Figure 5.
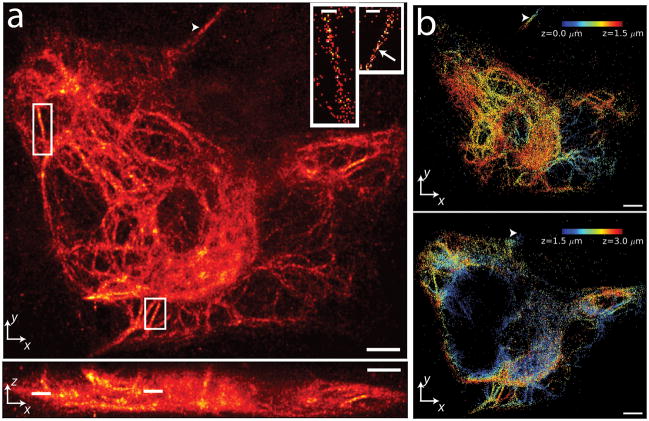
3D PALM-imaging of a vimentin network. (a) xy (top) and xz (bottom) maximum intensity projections of PA-mCherry1-vimentin. ~1 million unlinked localizations are rendered in each view. Insets show further magnification of white rectangles in xy (lines in xz) maximum intensity projection, highlighting individual vimentin fibrils in 60nm thick z slices (localizations are linked). Scale bar in each inset, 600 nm. Arrow indicates a region of fibril with apparent width < 100 nm. (b) Axial extent of vimentin network with z location indicated as a colormap. For clarity, localizations corresponding to 0–1.5 μm (top panel) and from 1.5–3 μm (bottom panel) are shown separately. Arrowheads in (a), (b) indicate a fibril that persists over > 2μm axially. Only linked localizations with correlation strength >0.4 are shown. Histogram bin sizes are 60 nm for all subfigures. Supplementary Video 3 steps through xy slices with 60 nm pixel size and 60 nm z separation. Scale bars 3 μm (a); 3 μm (b).

