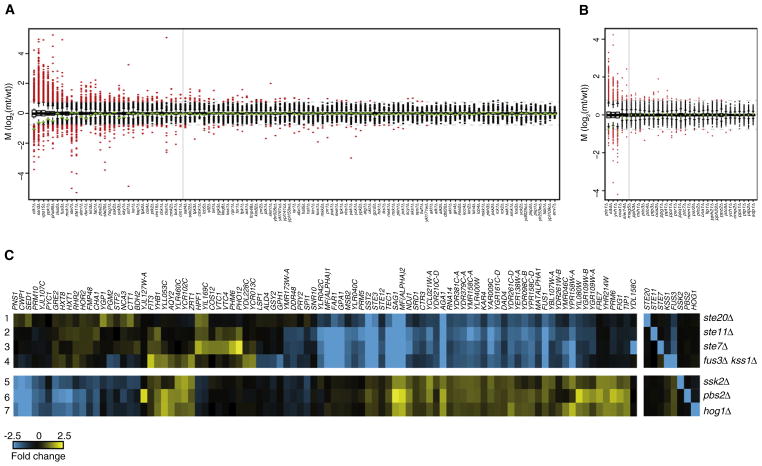
Figure 1. Expression Profiles of Kinase/Phosphatase Single Gene Deletions.
(A and B) Activity profiles of all deletion strains, ranked as box-whisker plots for kinases (A) and phosphatases (B), showing fold changes (vertical axis), with significantly changing genes (p < 0.05, FC > 1.7) as red dots and unresponsive genes as black dots. Green triangles indicate the doubling time of each mutant (-log2 relative to WT). Dashed gray lines indicate 1.7-fold change. The solid gray line is the threshold for distinguishing deletions with significant profiles (≥8 genes changing) versus deletions that behave similarly to WT (<8 genes changing). This threshold is based on the maximum number of changes observed in the 200 WT profiles, excluding the WT variable genes (Experimental Procedures).
(C) Lanes 1–7 are expression profiles of strains indicated to the right. All genes with significantly changed expression in any single mutant (p < 0.05, FC > 1.7) are depicted, with gene names on top. STE20, STE11, STE7 and FUS3 are the MAPK components of the mating pheromone response pathway. FUS3 is redundant with KSS1 and the profile of the double mutant is therefore shown in lane 4. Profiles of the single mutants are depicted in Figure 4C. SSK2, PBS2 and HOG1 are MAPK components of the HOG pathway. The opposite effects of the HOG pathway on some of the genes affected by the mating pathway agrees with inhibition of the mating pathway by the HOG pathway (Chen and Thorner, 2007).
See also Figure S1.

