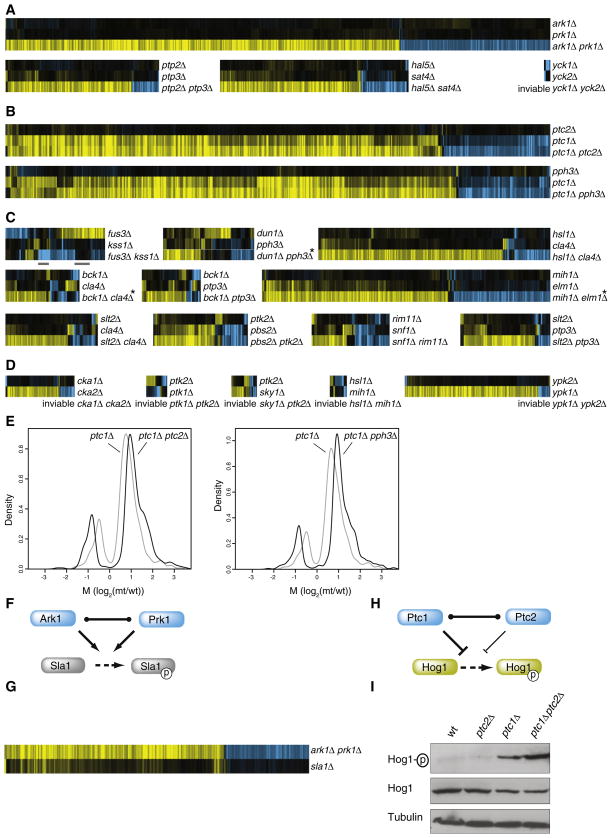
Figure 4. Expression Profiling Reveals Three Different Genetic Buffering Interactions.
For each set of three profiles all genes with changes in mRNA expression in any single profile are shown (p < 0.05, FC > 1.7).
(A) Complete redundancy whereby the single mutants have less than eight genes changing significantly and the double have more than eight.
(B) Quantitative redundancy, whereby one single mutant shows no significant profile (<8 genes p < 0.05, FC > 1.7), the other single mutant has a significant profile and in the double the same genes change to a higher degree.
(C) Mixed epistasis. Here at least 8 more genes change significantly in the double versus the two singles, with at least 8 genes behaving in other ways than in complete or quantitative phenotypes. The two bars below the FUS3-KSS1 profiles indicate the two gene sets selected for modeling (Figure 5).
(D) Unclassified buffering interactions due to inviability of the double mutant (Table 1).
(E) Quantification of the profiles shown in B, plotted for all genes with significant (p < 0.05, FC > 1.7) changes in mRNA expression in any one single or double mutant strain. M is the log2 ratio of normalized fluorescent mRNA expression in the mutant divided by WT. Asterisks indicate strains showing aneuploidy in the double mutant whereby all genes on aneuploid chromosomes were excluded from analyses.
(F) Complete redundancy can result from two proteins able to directly substitute for all of each other’s activity.
(G) Expression profiles of the ark1Δ prk1Δ double mutant and the target sla1Δ. All genes are depicted with significant changes (p < 0.05, FC > 1.7) in mRNA expression in any profile.
(H) Quantitative redundancy resulting from the ability of two proteins to directly substitute for each others activity qualitatively, but not quantitatively.
(I) Immunoblot as described in Figure 3C.

