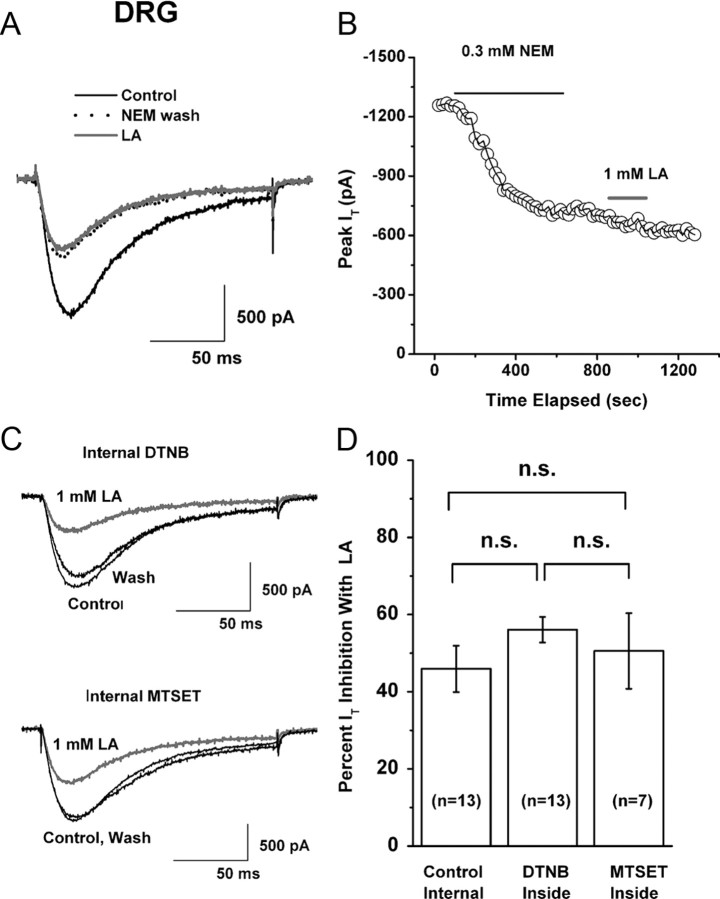
Figure 4.
Redox mechanisms of LA inhibition of T-current in DRG cells. A, Representative traces show LA (gray trace) inhibition of baseline T-current (black solid trace) in an acutely dissociated DRG cell after application of NEM (black dotted trace). B, Time course from the same experiment depicted in panel A of this figure. NEM inhibited ∼50% of the peak baseline T-current. When 1 mm LA was applied after NEM treatment, it induced only a small inhibition (∼10%) of the remaining inward current. Note that the inhibitory effect of NEM on peak T-current had a slower time course than did that of LA (Fig. 1B). The gray horizontal bar indicates the time of LA application; black horizontal line indicates the time of NEM application. C, Representative traces in gray show inhibition of baseline T-current (black traces) in different DRG cells. In both experiments, 1 mm LA was applied in the bath. Top panel shows the effect of LA on T-current in a cell where 1 mm DTNB was included in the internal solution; the bottom panel shows the effect of the same concentration of LA when internal solution was supplemented with 1 mm MTSET. Bars indicate calibration. D, Histogram represents the average effect of separate bath applications of 1 mm LA on T-currents in DRG cells with control internal solution (left column), and with internal solution containing either 1 mm DTNB (middle column) or 1 mm MTSET (right column). The average peak T-current inhibition was 46 ± 6% in control, 56 ± 3% with DTNB, and 51 ± 10% with MTSET. Vertical lines are ± SEM of multiple determinations. Number of cells in each experiment is indicated in parentheses. n.s., Not significant (p > 0.05).

