
Fig. 2.
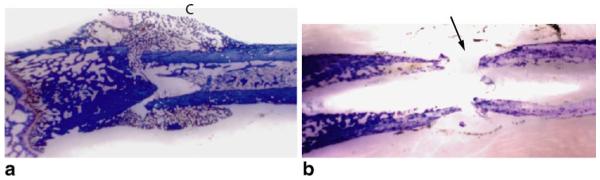
Histological longitudinal sections, stained with toluidine blue, of representative group I (a) and group II (b) femurs harvested 4 weeks after surgical treatment. Abundant bridging callus formation (C) indicative of healing is seen in the group I femur, while fibrous tissue and minimal new bone formation are seen at the operative site (arrow) for femurs in group II