
Fig. 3.
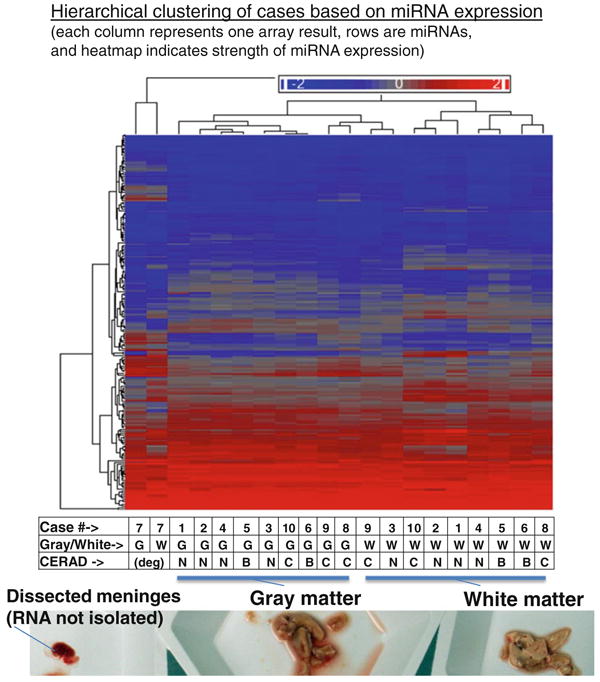
Hierarchial clustering of microarray results from gray matter and white matter of all ten brain samples evaluated in the current study. A representative photograph of gray and white matter tissue that had been freshly dissected for this study, prior to RNA isolation, is shown at the bottom of the figure. Each column of the heatmap figure represents a particular microarray sample. Each row is a miRNA (total N = 170 presumed conventional miRNAs). Heatmap coloring is based on miRNA expression levels. Both rows and columns are hierarchically clustered according to the Euclidean (default) method. The table at the bottom indicates which case the samples were derived from, whether the sample was gray or white matter, and the CERAD scores that indicate the densities of Alzheimer's disease-type neuritic amyloid plaques (B indicating moderate density of neuritic plaques and C indicating high density of neuritic plaques). Both samples from case 7, with degraded RNA, clustered separately from all the others. Note that among the non-degraded samples, gray matter-derived samples cluster separately from all the white matter samples. Further, there is a tendency of cases to cluster together that have similar CERAD scores