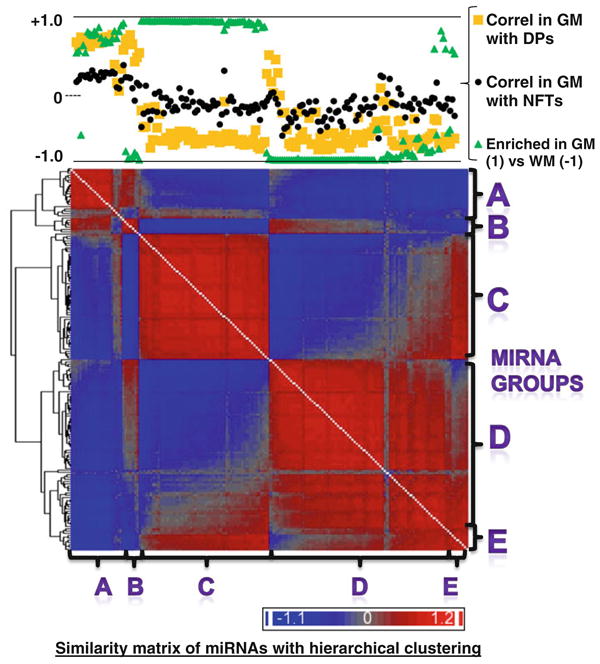
Fig. 4.

Hierarchial clustering of gene expression similarity matrix that allowed us to visualize the similarity of the patterns of miRNA expression across different cases including both gray matter and white matter samples. In this heatmap, all the rows and columns are miRNAs [each miRNA (N = 170, corresponding to the presumed conventional miRNAs shown in Supplemental Table 1) occupies one column and one row] and the heatmap represents the degree of similarity of expression for the various different miRNAs. This diagram allows us to visualize the phenomenon that groups of miRNAs appear to have similar expression patterns that contrast sharply with other groups of miRNAs. The chart at the top of the figure shows how these same miRNAs are correlated with the densities of Alzheimer's disease (AD)-type pathology [diffuse plaques (DPs) and neurofibrillary tangles (NFTs)] with correlation being indicated by the R value of correlation across cases 1–10. The degree of enrichment in gray matter (GM) or white matter (WM) is also charted. All these values are available in Supplemental Table 1. Based solely on visual inspection of this diagram, we segregated the miRNAs into five different groups (A–E) and sought to test the hypothesis that miRNAs in the different groups may have systematically different tendencies to be enriched in gray or white matter, and/or different correlative relationship with the density of Alzheimer's disease-type pathological lesions
