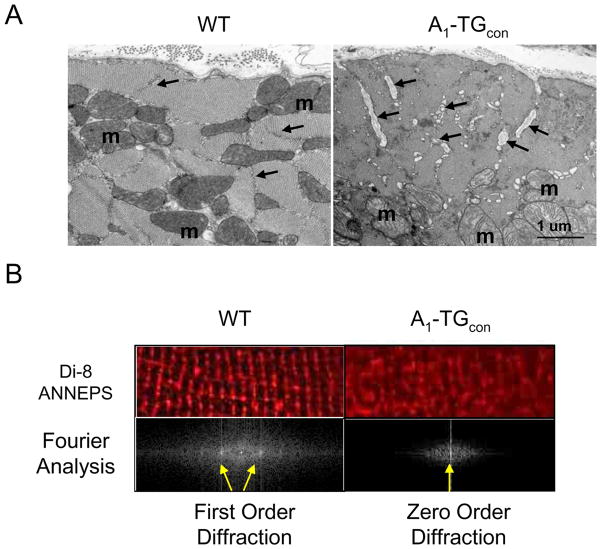
Figure 2.
A. Electron microscopy images of myocardial sections of male 12–14 week WT (n=3) and A1-TGcon (n=3) mouse hearts. T-tubules (arrows) are dilated in the transgenic cardiac muscle. The dilated T tubules contain membranous and basement membrane-like material; m=mitochondrion. Bar = 1 micron. B. T-tubules were stained with the voltage sensitive lipid dye, di-8-ANNEPS, in live WT and A1-TGcon myocytes. Confocal digital images were processed using Fast Fourier Transform (FFT) algorithm to quantify organization of T-tubule within myocytes. The power spectrum in log scale vs spatial frequency was calculated for each image and indicated by the appearance of zero or first order diffraction spots (arrows).

