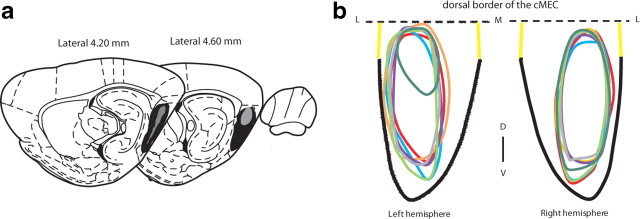
Figure 3.
Extent and location of the cMEC lesions. a, Area measurements. Gray, Smallest lesion; black, largest lesion. b, Unfolding the cMEC revealed that damage was restricted to the cMEC. Seven individual lesions are represented. The dashed black line represents the dorsal border of the cMEC and the thick continuous black line represents the ventral border of the cMEC, according the rat brain atlas of Watson and Paxinos. The unfolded map is restricted to the mediolateral levels ± 3.4–5 (yellow lines) and the anteroposterior levels −7.5 to −10. D–V, Dorsoventral axis; L–M–L, mediolateral axis.

