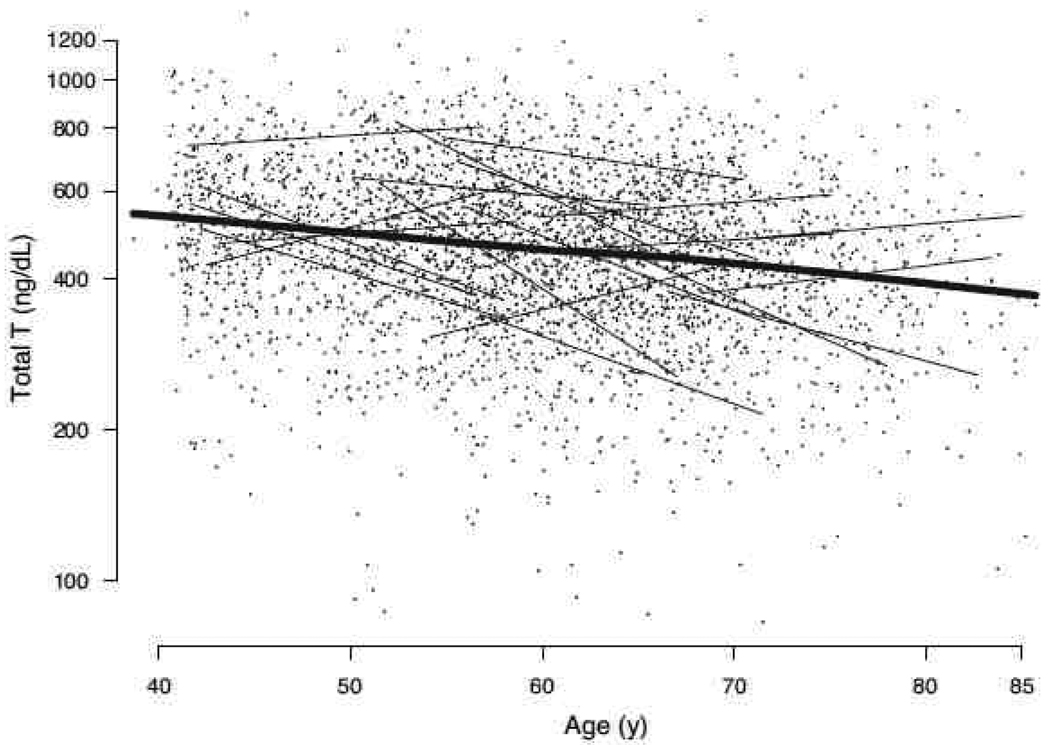
Figure 2.
Total testosterone vs. age (natural log scale for all observations). Linear trajectories for 20 randomly chosen subjects are plotted (thin lines), demonstrating the substantial inter-subject variation in testosterone trends over time. A nonparametric, locally weighted regression smooth (thick line) depicts the linear decline in log testosterone values with age over all observations, which is generally outstripped by within-subject longitudinal decline. To convert total testosterone from nanograms per deciliter to nanomoles per liter, multiply by 0.0347. Source: MMAS, Travison et al, J Clin Endocrinol Metab 2007; 92(2):549– 555. 58 Copyright 2007, The Endocrine Society. Used with permission.

