
Figure 2.
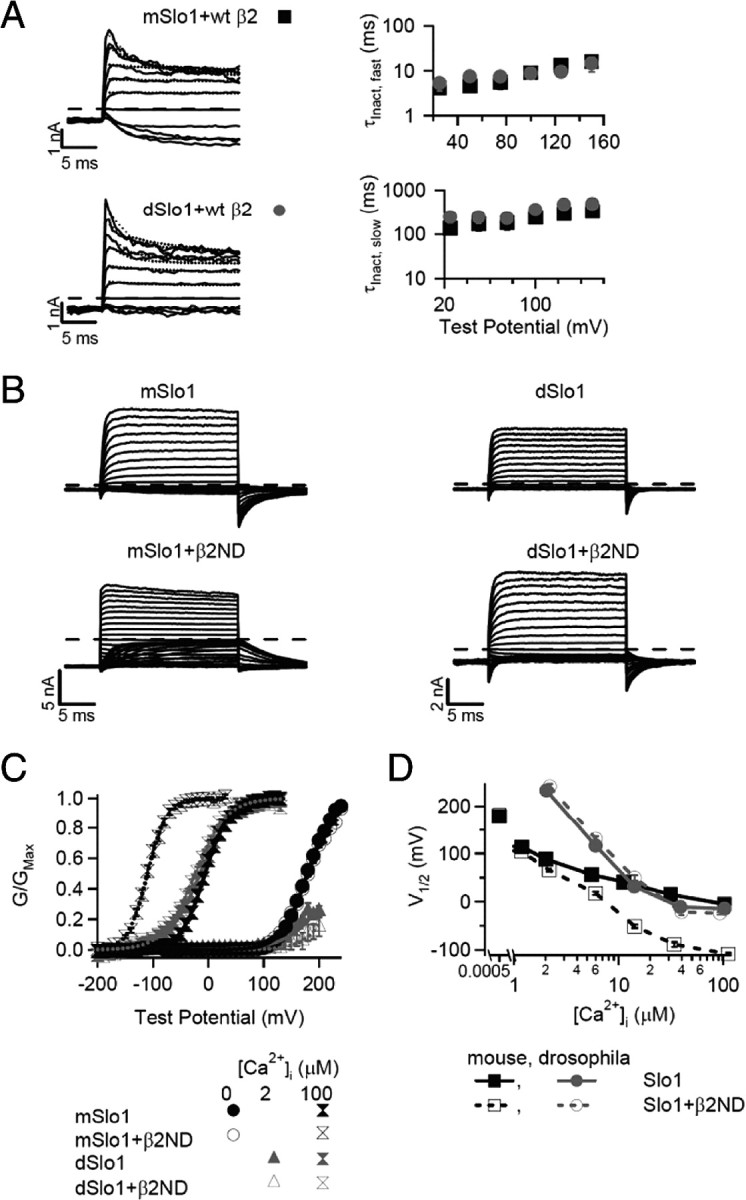
Differential modulation by β2ND on Ca2+ sensitivity of mSlo1 and dSlo1. A, Macroscopic currents of mSlo1 and dSlo1 with WT hβ2 at ∼100 μm [Ca2+]i (left). The voltage pulses are from −100 to +150 mV for 1 s with 25 mV increments (shown only the first 20 ms), and the prepulse potential is −140 mV for 195 ms (shown only the last 5 ms). The dotted line represents the biexponential fit of the inactivation profile, and the long dashed line represents the zero current line for each current trace. On the right, voltage dependence of the inactivation time constant is shown. The fast and slow components of τInact were obtained by fitting current traces with a biexponential function from the peak amplitude to steady state (n = 10 for mSlo1 + WT β2, except at +150 mV, n = 9; n = 5 for dSlo1 + WT β2, except at +150 mV, n = 4). B, Macroscopic currents of mSlo1 and dSlo1 with and without β2ND at ∼100 μm [Ca2+]i. Voltage pulses are from −200 to 100 mV with 10 mV increments, and the repolarizing potential is −50 mV, except for mSlo1 + β2ND, which is −80 mV. The dashed line represents the zero current line for each current trace. C, Mean G–V relationship of mSlo1/dSlo1 with and without β2ND in 0, ∼2, and ∼100 μm [Ca2+]i, fitted with Boltzmann equation (smooth lines). The error bars in this and other figures show the SEM. D, V½ versus [Ca2+]i plot of mSlo1/dSlo1 with and without β2ND. The number of patches for each dataset are for the following (μm): [Ca2+]i, 0, 1, 2, 5, 10, 30, 100; mSlo1, 118, 33, 29, 29, 42, 25, 56; mSlo1 + β2ND, 44, 8, 8, 11, 9, 12, 28; dSlo1, 0, 0, 11, 19, 15, 9, 27; dSlo1 + β2ND, 0, 0, 3, 4, 7, 8, 14.