
Figure 6.
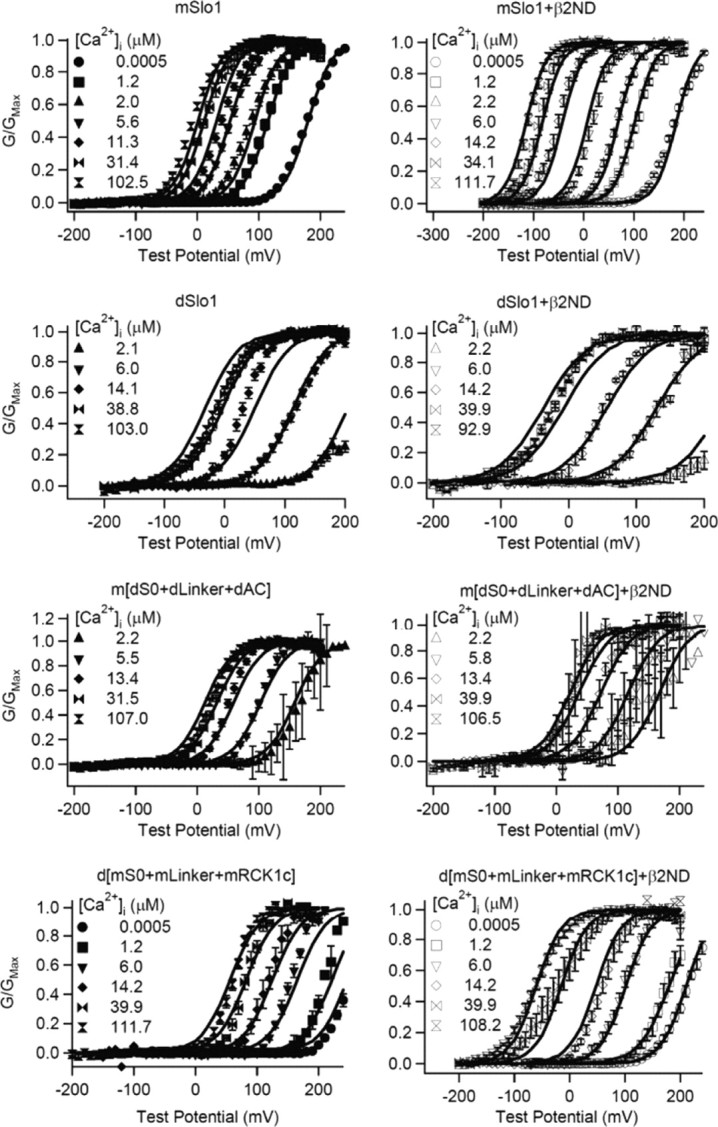
MWC model fittings of WT and chimera channels. G–V relationships (symbols) for mSlo1, dSlo1, m[dS0 + dLinker + dAC], and d[mS0 + mLinker + mRCK1c] with and without β2ND fitted with the MWC model (lines). The [Ca2+]i for each symbol is shown.