
Figure 4.
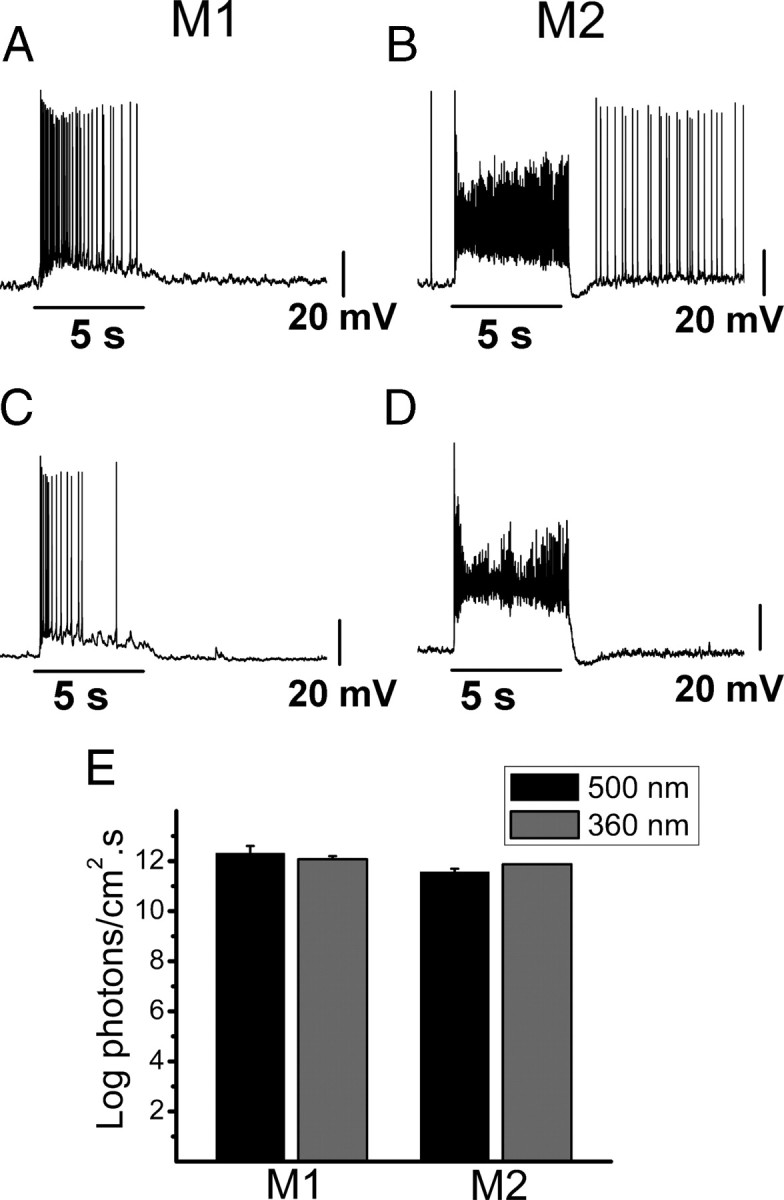
Synaptic responses of M1 and M2 cells in Opn4−/− mice to 500 and 360 nm light. Current-clamp recordings of light-evoked depolarization of M1 and M2 cells to 5 s 500 or 360 nm light stimulation of increasing intensities. A–D, Representative examples of light-evoked depolarization of M1 cell to 500 nm light stimulus at 15.2 log photons · cm−2 · s−1 (A), M2 cell to 500 nm light stimulus at 14.7 log photons · cm−2 · s−1 (B), M1 cell to 360 nm light stimulus at 13.4 log photons · cm−2 · s−1 (C), and M2 cell to 360 nm light stimulus at 12.9 log photons · cm−2 · s−1 (D). E, Average intensity (log photons · cm−2 · s−1) at which a synaptic response was detectable for M1 and M2 cells to 500 nm (black bars) and 360 nm (gray bars) light stimuli.