
Figure 6.
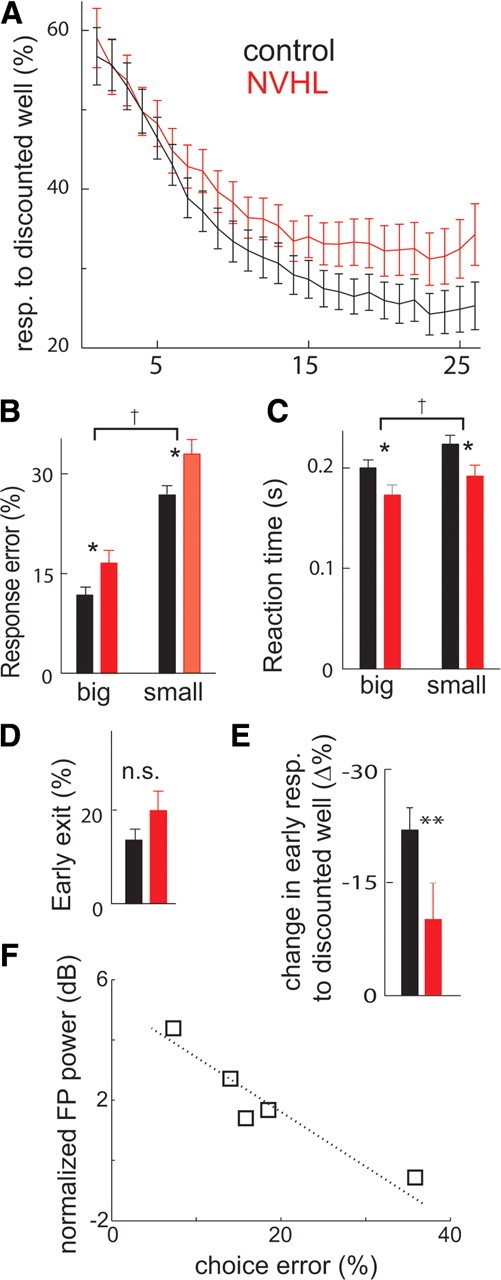
Behavioral deficits in NVHL rats. A, Plot of group-averaged response (resp.) choices during sequential free-choice trials within behavioral blocks, showing that both groups of rats develop a bias against the well giving small rewards as blocks progress, but NVHL rats (gray, n = 6) showed less bias than control rats (black, n = 5). B, Bar plot of response errors on forced-choice trials showing that rats made more response errors on forced trials for small rewards and that NVHL rats made more response errors than controls. C, Bar plot of reaction times showing that rats had faster reaction times for big rewards than small rewards, and NVHL rats had faster reaction times than controls for both reward sizes. D, Bar plot of premature exits from the odor port showing that NVHL rats had a nonstatistically significant trend to make more premature exits from the odor port. E, Bar plot of mean change in responses away from the discounted reward well on the first five free-choice trials in each block compared with the preblock bias, showing response perseveration in NVHL rats on the second block compared with controls. For all plots, significance at the 95% level by main effects of two-way ANOVA (†), Tukey–Kramer post hoc test (*) and t test (**) are indicated. Error bars indicate ±SEM. F, Changes in field-potential power during odor presentation correlate with performance in the task. Error rate during forced-choice trails plotted against average power during odor presentation normalized by the preodor value for the 1–30 Hz frequency band in control rats. The line was generated by linear regression of data points. n.s., Not significant.