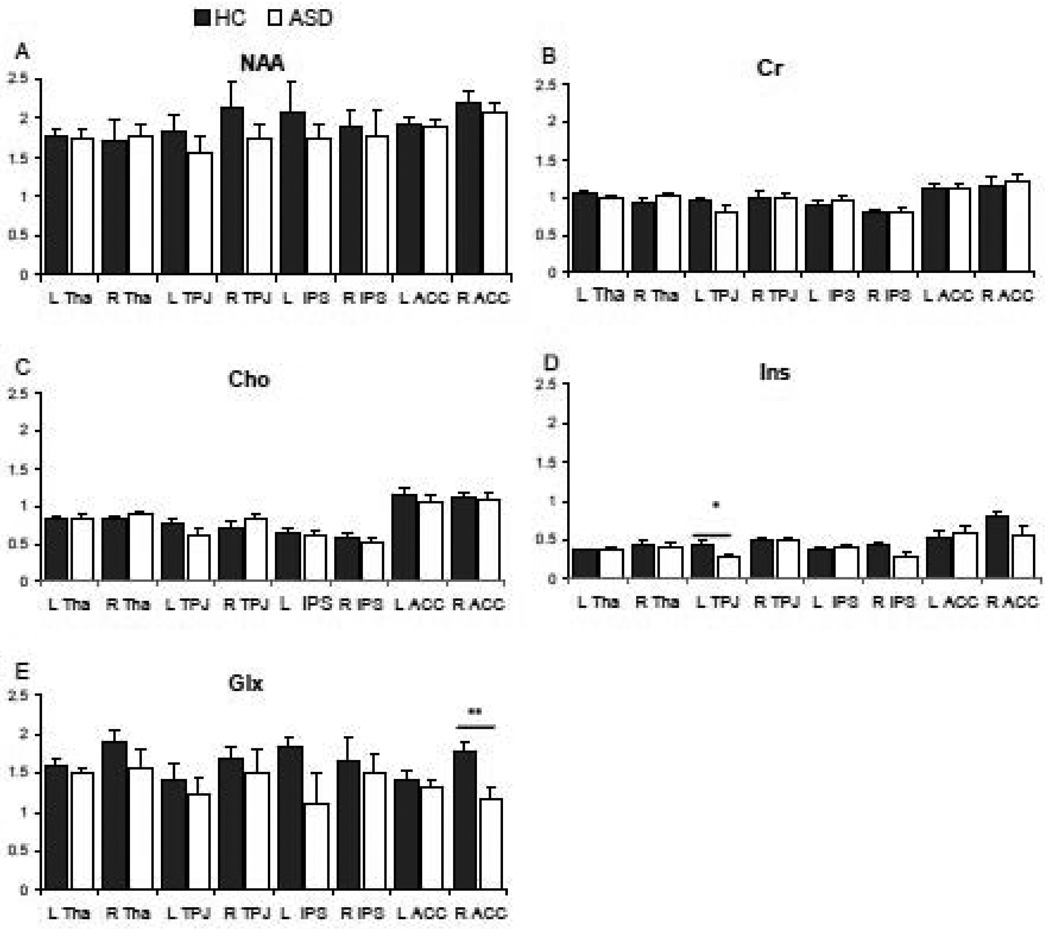
Figure 2.
Metabolites amplitude in adults with autism spectrum disorder and healthy controls. Note: * p < 0.03 significance evaluated with ANCOVA with age and IQ as covariates; ** p < 0.006 with ANCOVA with age and IQ as covariates; data are expressed as means and error bars represent standard errors; Glx, glutamate+glutamine; L, left; R, right; ACC, anterior cingulate cortex; IPS, intraparietal sulcus; TPJ, temporoparietal junction; ASD, autism spectrum disorder; HC, healthy control.

