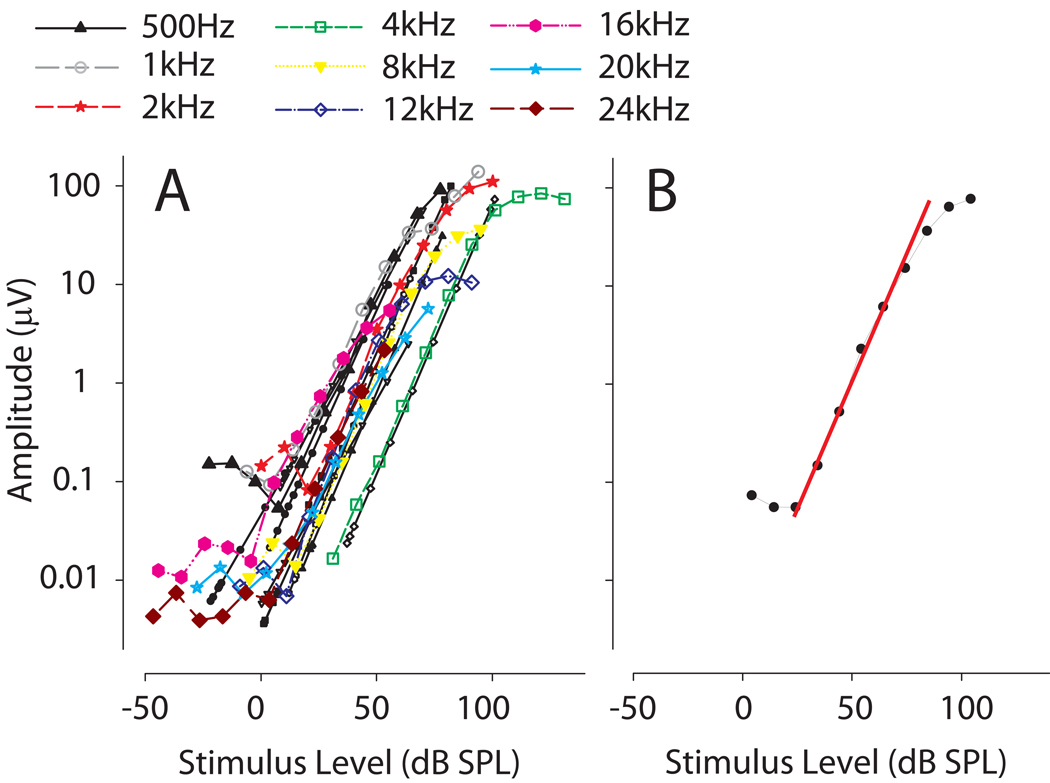
Figure 1.
A: Cochlear microphonic (CM) amplitude recorded from the left ear of one study subject as a function of tympanic membrane stimulus level (dB SPL) for 9 frequencies. The CM amplitude increased linearly over a wide range of SPLs. The average (n=6) CM amplitude dynamic range across frequencies was found to be 56.1 ± 3.1 dB (SD) with a range of 53.3 to 59.2 dB B: Linear regression curves (RED line) were fit to the linear portion of the CM response. The regression curve was used to convert measured CM amplitudes at a given frequency to the equivalent SPL value at the tympanic membrane. This technique was employed to circumvent unknown patency status of the probe tube microphone after plugging.

