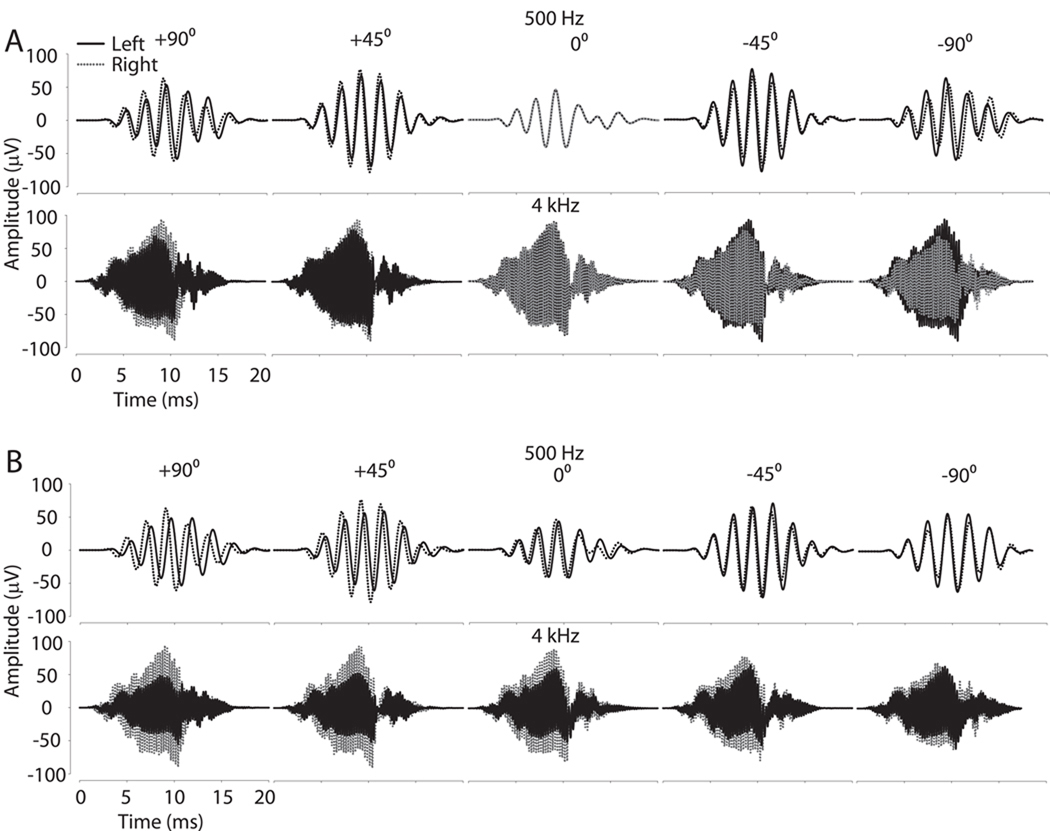
Figure 2.
Example CM waveform recordings from one representative subject for two different frequencies (500 Hz and 4 kHz) at five sound source positions in azimuth (−90°, left side; +90°, right side). A: CM amplitudes and timing delays at the left (black line) and right (dashed) ears vary as a function of sound source azimuth. B: CM waveform recordings after occlusion of the left (dashed) ear. Note that after occlusion, the left ear CM waveform is delayed and attenuated as compared to the waveform observed in panel A.

