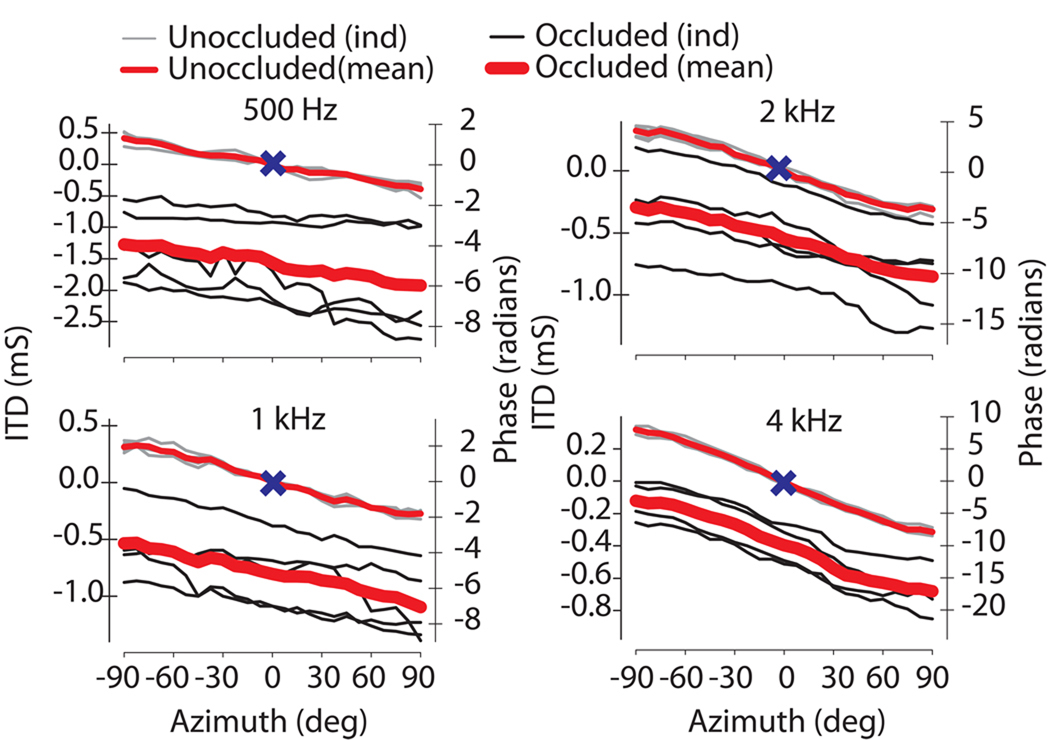
Figure 8.
Mean and individual occluded (thick RED = across animal mean, thin BLACK = individual animals) and unoccluded (thin RED = across animal mean, thin GRAY = individual animals) interaural time (left ordinate) and phase differences (right ordinate) as a function of stimulus azimuth (+90° 12 = right) for four frequencies (500 Hz – 4 kHz) for a left ear occluded convention (n=5). Positive time and phase differences indicate stimulus arrival at left ear before the right ear (left ear leading). Occlusion introduced a downward shift of the frequency dependent unoccluded ITD curve. 0° azimuth and 0 ms ITD indicated by X.

