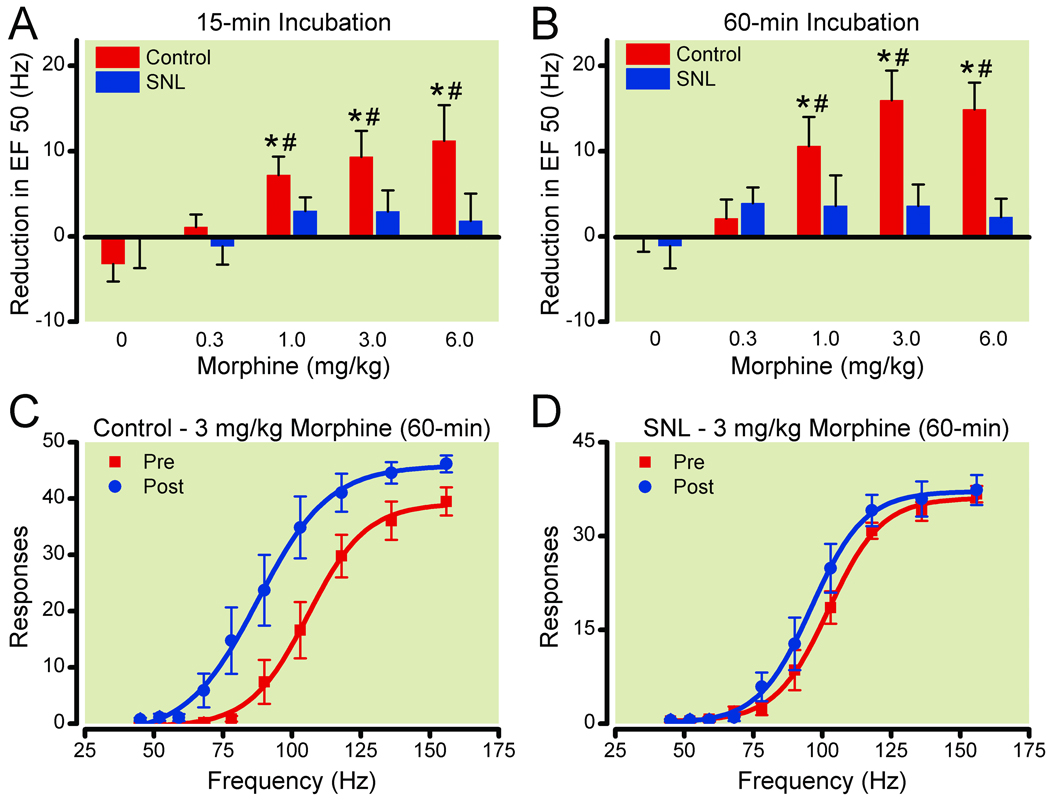
Figure 3. Effects of spinal nerve ligation (SNL) on morphine facilitation of electrical stimulation of the ventral tegmental area for drug incubation times of 15-min (A) and 60-min (B).
Reduction in EF50 (frequency at which rats emitted 50% of maximal responding) was calculated by subtracting the EF50 for the three components following drug injection (5–7) from the EF50 for the two components preceding drug injection (3–4) for each dose assessed. Data shown are averages across control (n=7–8) and SNL (n=6–7) rats. Frequency-response curves before and after 3mg/kg morphine (60-min) are shown for control (C, n=8) and SNL (D, n=7) rats. * Significantly different from saline treatment P ≤ 0.05. # Significantly different from SNL rats P ≤ 0.05.

