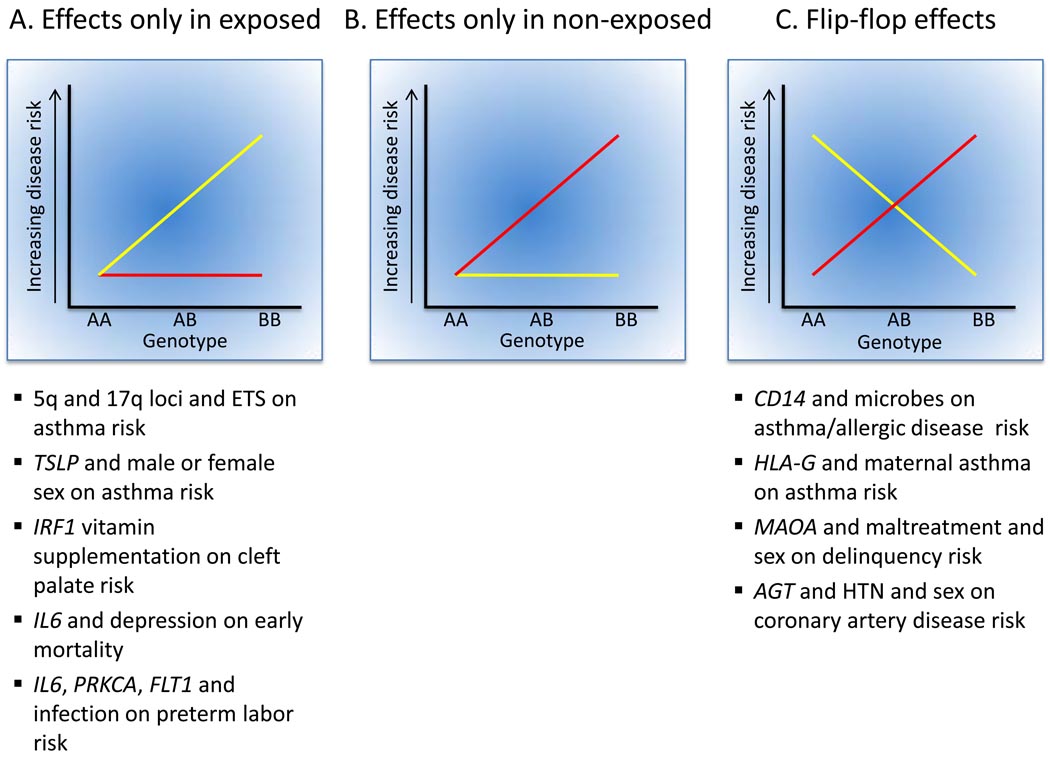
Figure 2.
Types of GEIs. The yellow line in each panel corresponds to risk in exposed individuals; the red line corresponds to risk in non-exposed individuals. Examples from this review that illustrate each type of interaction are shown below the panels. It is notable that no clear examples of specific SNPs or genes involved in GEIs limited to non-exposed individuals were reported in the studies reviewed here, including the recent GWIS of farming exposures and asthma99. Not all interactions shown have been replicated or substantiated by other reports in the literature.

