
Figure 3. Role of NPSR1 in OVA or Aspergillus -induced experimental asthma.
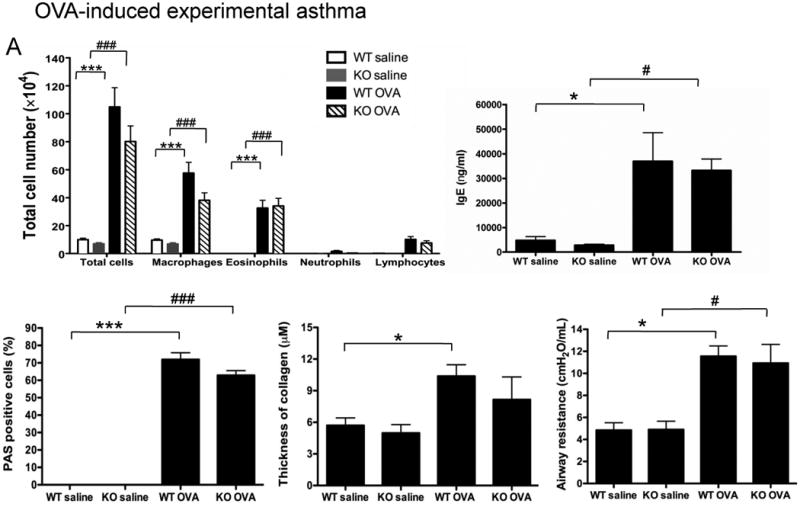
(A) OVA-induced experimental asthma. Forty eight hours after the final challenge, OVA- or saline-challenged Npsr1-deficient (KO) and wildtype (WT) mice were assessed for BALF cell populations (n = 7 - 10 for each group), serum IgE level (n = 5 - 8 for each group), mucus-secreting cells (n = 4 for each group), and collagen deposition in the lung (n = 4 for each group). Airway responsiveness to 37.5 mg/ml methacholine was assessed by flexiVent 24 hours after the final OVA challenge (n = 6 - 8 mice for each group). Data are representative of one of three experiments. Values are presented as mean ± SEM. * p < 0.05 and *** p < 0.001 indicate the comparison of OVA-treated and saline-treated WT mice; # p < 0.05 and ### p < 0.001 indicate the comparison of OVA-treated and saline-treated KO mice.
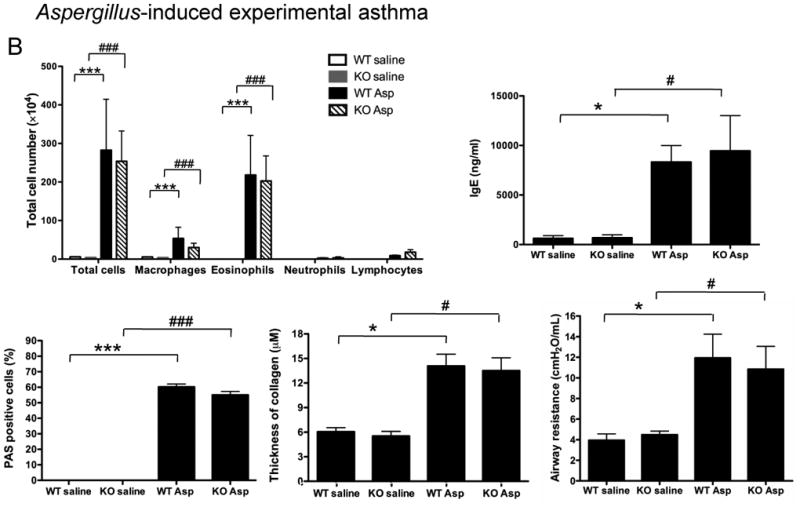
(B) Aspergillus-induced experimental asthma. Eighteen hours after Npsr1-deficient (KO) and wildtype (WT) mice received a final challenge with Aspergillus or saline, BALF cell populations (n = 7 - 8 for each group), serum IgE level (n = 5 - 6 for each group), mucus-secreting cells (n = 4 for each group), collagen deposition in the lung (n = 4 for each group), and airway responsiveness to 37.5 mg/ml methacholine by flexiVent (n= 8 - 9 mice for each group) were evaluated. Data are representative of one of three experiments. Values are presented as mean ± SEM. * p < 0.05 and *** p < 0.001 indicate the comparison of Aspergillus-treated and saline-treated WT mice; # p < 0.05 and ### p < 0.001 indicate the comparison of Aspergillus-treated and saline-treated KO mice.