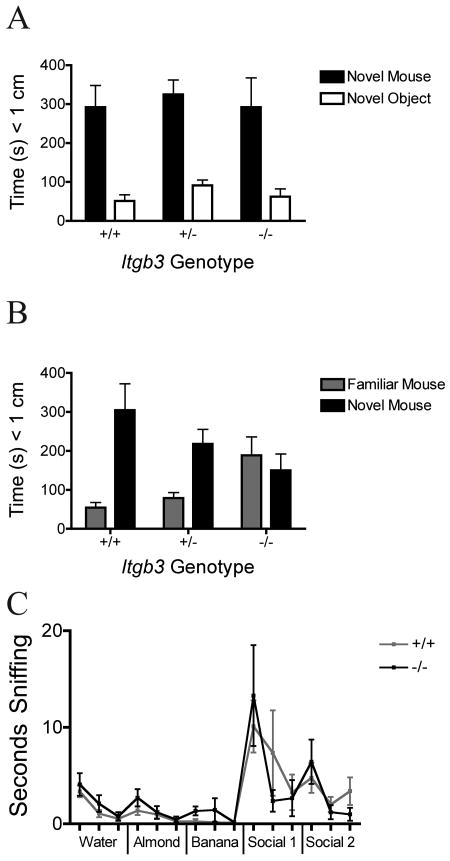
Figure 3. Social and Olfactory Behavior.
A and B: Three-chamber social test. Mean and standard error of the mean are shown by genotype (10 +/+, 20 +/-, 6 -/-) for the cumulative data over each 10-minute test session. A: Time spent within 1 cm (‘sniffing’) of the wire cage containing the novel mouse or the novel object (empty wire cage). B: Time spent within 1 cm of the wire cage containing the familiar mouse or the novel mouse. C: Olfactory Habituation-Dishabituation. Mean and standard error of the mean are shown by genotype (11 +/+, 8 -/-) for the time spent within 2 cm of the cotton swab containing the odor stimulus over each 2-minute odor presentation.

