
Figure 2.
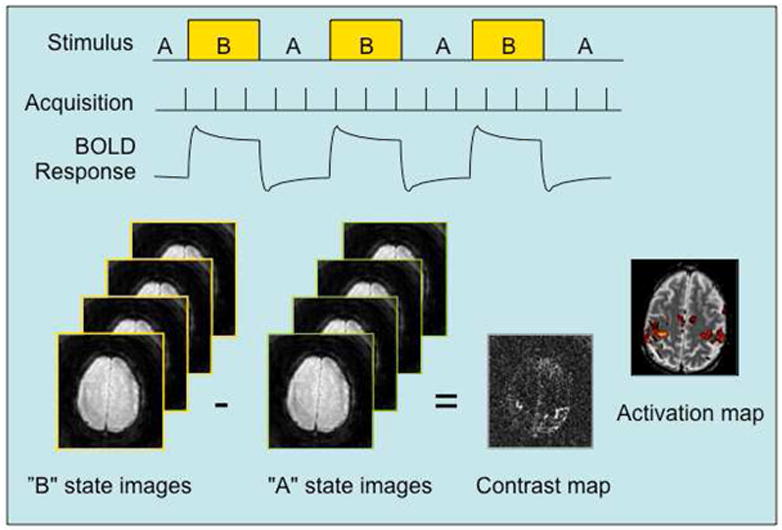
Block design fMRI experiment. A neural response to the state change from A to B in the stimulus is accompanied by a hemodynamic response (as shown in Fig. 1) that is detected by the rapid and continuous acquisition of MR images sensitized to BOLD signal changes. Using single- or multi-variate time series analysis methods, the average signal difference between the two states is computed for the scan and a contrast map generated. A statistical activation map is finally obtained using a suitable threshold for the difference; the map depicts the probability that a voxel is activated given the uncertainty due to noise and the small BOLD signal differences.