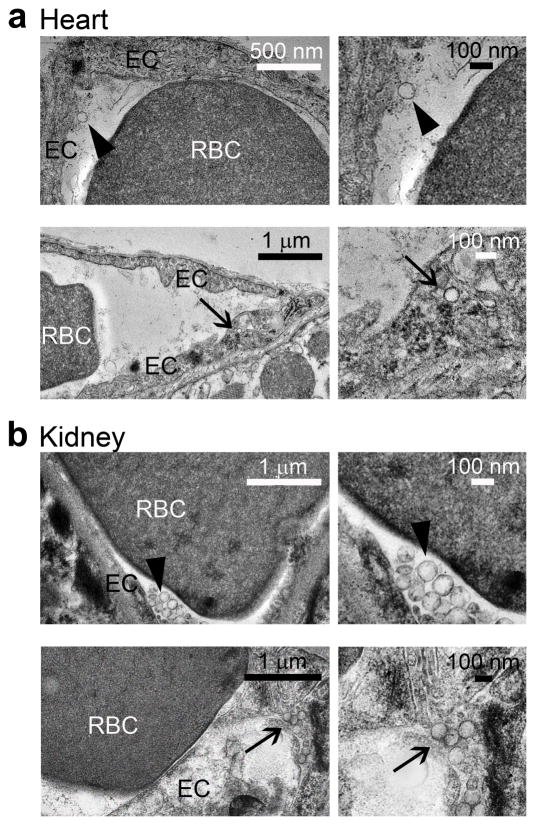
Figure 2. Visualization of anti-ICAM/α-Gal nanocarriers in mice.
Transmission electron micrographs showing the presence of anti-ICAM/α-Gal NCs in (a) heart and (b) kidney, both attached to the endothelial surface (arrowheads, upper panels) and internalized within cells (arrows, bottom panels) by 30 min after injection.

