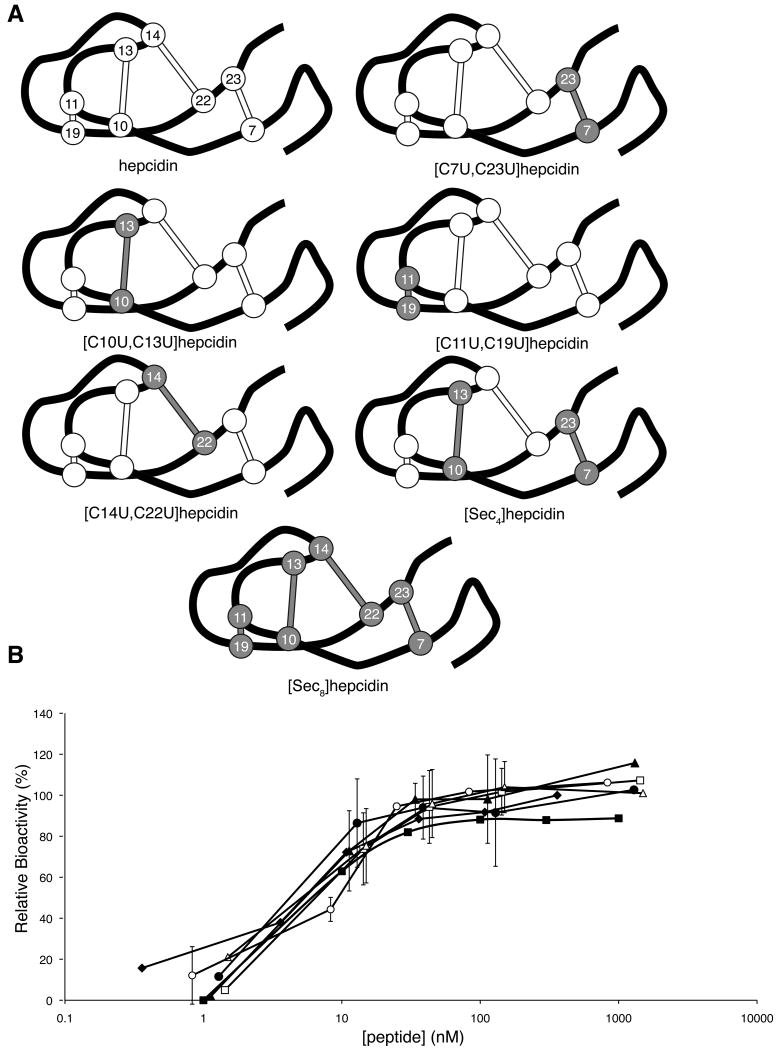
Figure 5.
Selenocystine analogues of hepcidin. (A) Schematic representation of native hepcidin and the selenocystine analogues synthesised in this study. The peptide backbone is represented by the black line, disulfides as white ball and sticks and diselenides and gray ball and sticks. Each disulfide/diselenide is numbered based on its position in the sequence. (B) Dose-response curve for hepcidin (filled diamonds), [U7C,U23C]hepcidin (filled squares), [C10U,C13U]hepcidin (filled triangles), [C11U,C19U]hepcidin (filled circles), [C14U, C22U]hepcidin (open squares), [Sec4]hepcidin (open triangles) and [Sec8]hepcidin (open circles). HEK293T cells stably expressing ferroportin-GFP construct were treated with varying concentrations of peptide for 24 h and the intensity of green fluorescence was then measured by FACS. See also Figure S2.

