Figure 6.
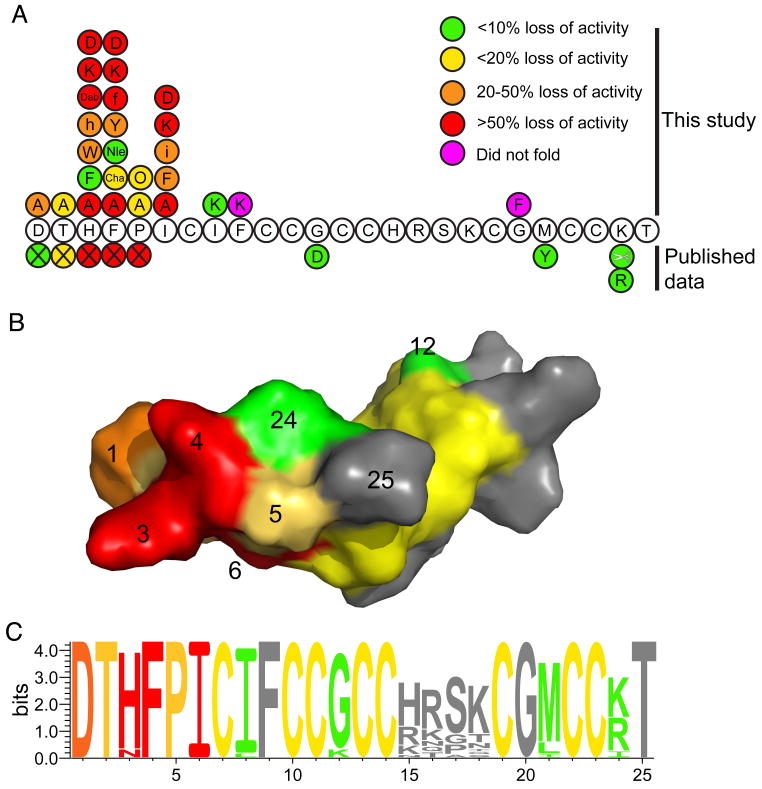
Summary of structure/activity relationships of hepcidin. (A). The sequence of hepcidin showing the effect on activity of mutations from this study, naturally occurring mutations and truncation of the N-terminal residues (indicated by the X symbol) (Nemeth, et al., 2006). The colours indicate the percentage loss in activity relative to hepcidin as follows: green <10% loss in activity; yellow 10-20% loss; orange 20-50% loss; red >50% loss. Mutations shown in magenta are peptides that did not fold. (B). A surface representation of hepcidin with the surface colour-coded using the same scheme as panel A. The activity data presented is for the alanine mutants plus the known natural mutations. It can be seen that residues His3, Phe4 and Ile6 form a localised patch on the surface of the molecule. The conserved cysteines are coloured yellow. (C). A sequence logo representation (Schneider and Stephens, 1990) of hepcidin, coloured using the scheme from panel A. The activity data presented is for the alanine mutants together with the known natural mutations and the C-terminal truncation data (Nemeth, et al., 2006). The relative heights of the amino acids symbols at each position represent the degree of sequence conservation at each of these positions. As expected, the residues towards the N-terminal region of the peptide that are important for the interaction of hepcidin are the most highly conserved whereas those around the β-turn show lower sequence conservation.

