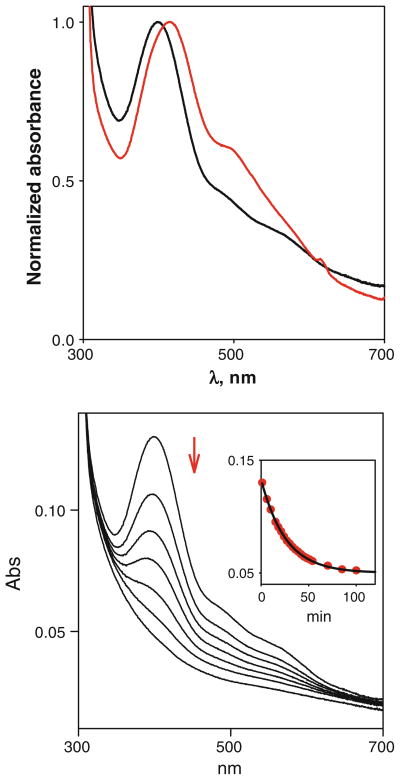
Fig. 5.
Top UV/visible spectra of H135M (black) and H135SeM (red). Bottom autoreduction of the H135M variant (40 μM), showing bleaching of the spectrum associated with conversion to the Cu(I) form. The inset shows the time dependence of the process fitted to a single exponential decay with rate constant 0.4 × 10⁻³ s−1

