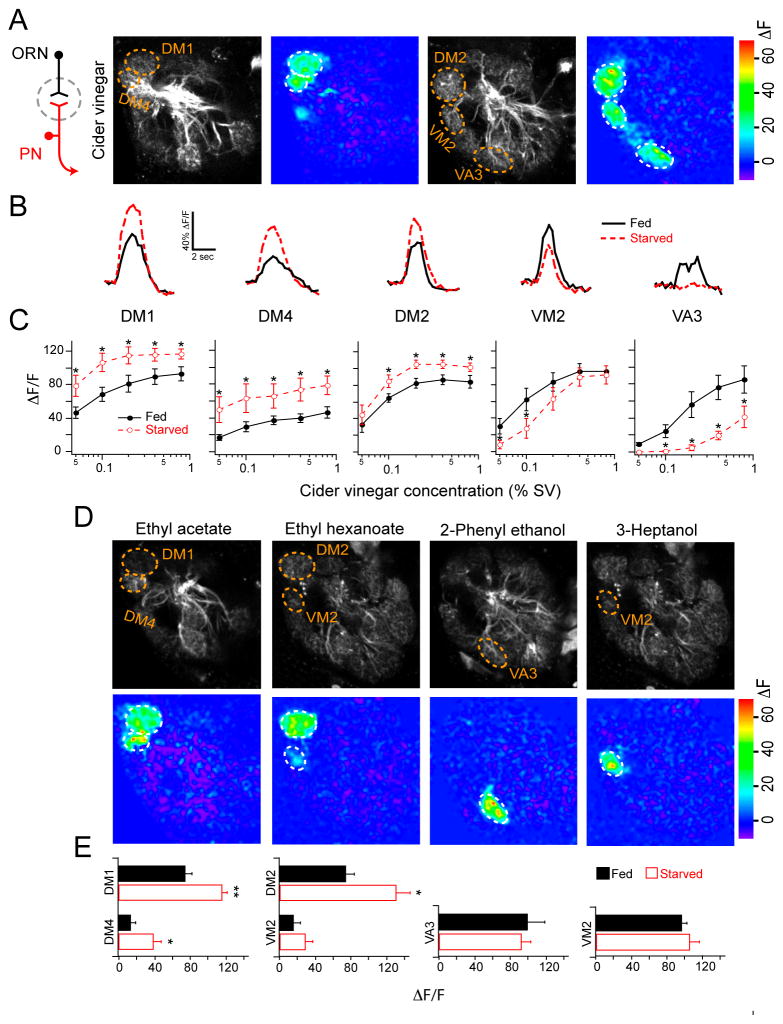
Figure 1. Olfactory representation in projection neurons is altered by starvation.
A, Two-photon imaging of PN calcium activity in response to cider vinegar stimulation on two optical planes of the antennal lobe in fed flies. Gray-scale images show antennal lobe structure while pseudocolored images reveal odor-evoked activity at 0.4% SV (saturated vapor pressure). B, Representative traces of fluorescence change over time for the five glomeruli excited by cider vinegar at 0.1% SV. C, Peak ΔF/F across a range of cider vinegar concentrations for each glomerulus. D, PN activity of fed flies in response to pure odorants. E, Peak ΔF/F for each glomerulus. D,E, Odors were applied at the following concentrations (%SV): 1% ethyl acetate 1:10,000 in mineral oil, 0.1% ethyl hexanoate 1:10,000 in mineral oil, 0.5% 2-phenyl ethanol, and 0.1% 3-heptanol. C,E, n=5–10 for each condition; error bars show SEM. *P<0.05, **P<0.01; t-test. The flies have GH146-Gal4 and UAS-GCaMP. All starvations were 17–24 hrs.

