
Figure 4.
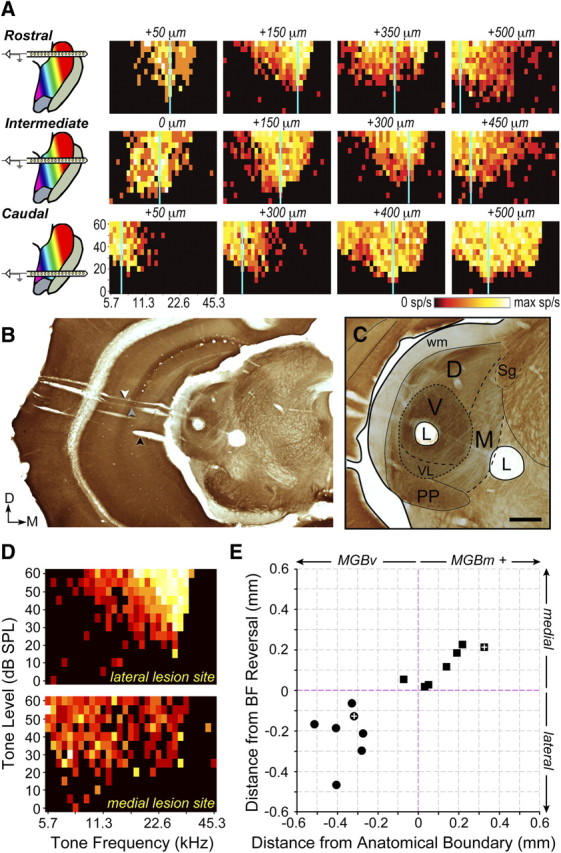
Neurophysiological dissociation of MGBv from MGBm. A, Recordings were made along the lateral-to-medial extent of the MGB (across columns) using a multichannel silicon probe inserted along the same plane used for the thalamocortical slice. Multiple penetrations were made in each mouse to permit comparison of recordings made across the rostral-to-caudal extent of the MGB (across rows). Distance from the lateral wall of the MGBv is stated for FRA. Vertical blue line represents BF. B, C, low- and high-power images of a coronal section reacted for cytochrome oxidase. The black arrow indicates the initial probe insertion to locate the ventral margin of the MGB (see Materials and Methods), the gray arrow indicates the track made by the silicon probe penetration used for recordings, and the white arrow represents the electrode track used to create the lesions. C, High-power image depicts the location of two lesions (L) drawn relative to neighboring anatomical landmarks. D, FRAs measured immediately before lesioning at the lateral and medial lesion sites shown in B and C. E, The location of lesions made lateral or medial to the BF reversal point (circles and squares, respectively) are shown relative to the anatomical boundary dividing MGBv from MGBm, along with the electrode travel distance from the frequency reversal. MGBm+ indicates that data points could have been drawn from auditory-responsive sites medial to the MGBm. White crosses represent the lesions shown in B and C. sp/s, Spikes per second; PP, peripeduncular nucleus; wm, white matter. Scale bar, 0.25 mm.