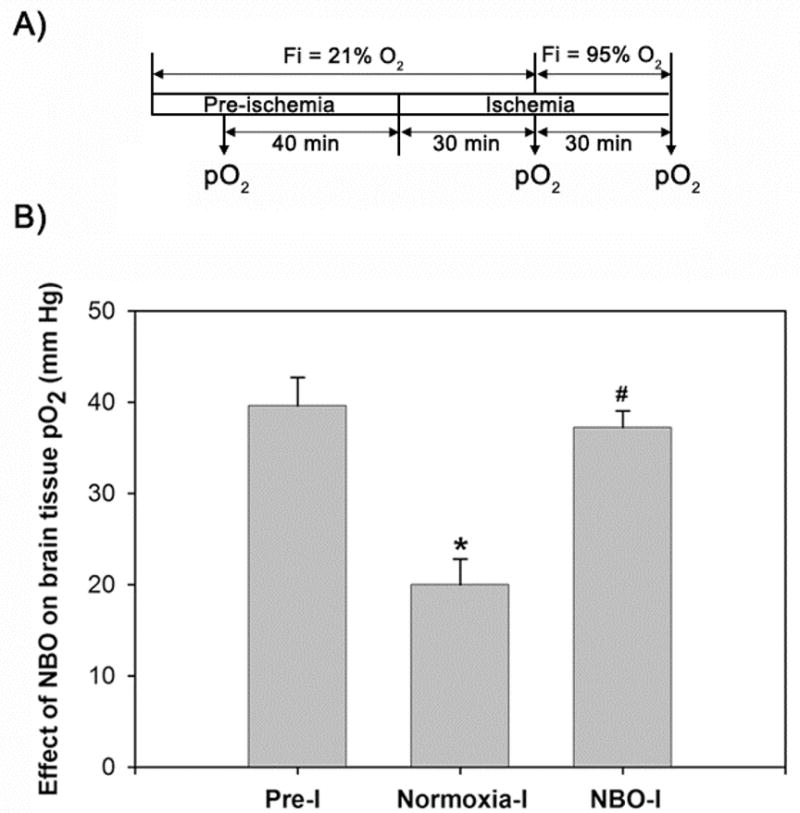
Figure 1.

NBO during ischemia raises the cerebral tissue oxygenation pO2 in the ischemic penumbra to the pre-ischemic level. A) The sketch shows that the penumbral pO2 values were measured in vivo by EPR oximetry in the anesthetized rats 40 min before ischemia (FiO2: 21% O2, Pre-I), 30 min after the start of ischemia (FiO2: 21% O2, Normoxia-I), and then 30 min after the start of NBO treatment (FiO2: 95% O2, NBO-I). FiO2: inspired oxygen fraction. B) Bar graph shows the changes of the pO2 levels in the ischemic penumbra. Data were expressed as mean ± SEM, n = 5. *p < 0.05 versus Pre-I, #p < 0.05 versus Normoxia-I.
