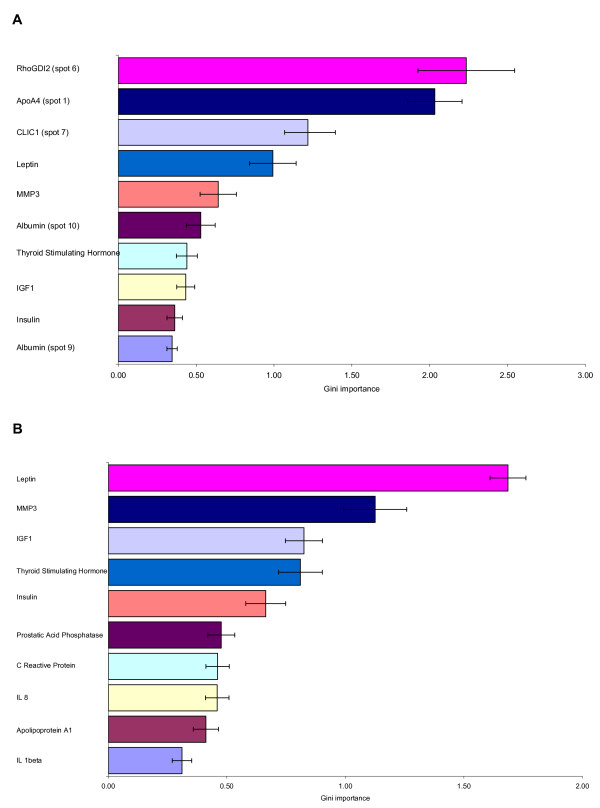
Figure 4.
Biomarkers of extended fasting effect calculated by Random Forrest analysis. Panel A: results obtained from analysis of all proteomic data (2D and RBM). Panel B: results obtained from targeted proteomic analysis using multiplex immunoassay (RBM). The spot numbers between brackets refer to those used in Table 2. Proteins without numbers between brackets refer to those used in Table 3.

