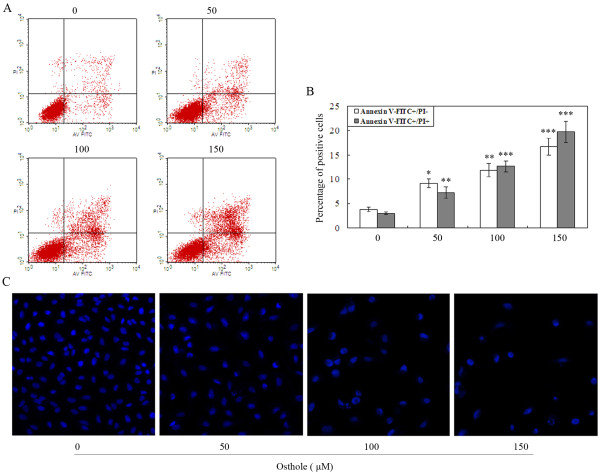
Figure 4.
Apoptosis analysis by flow cytometry and fluorescent microscopy. (A) Apoptotic rates analysis by Annexin V/PI staining. A549 cells were treated with (0, 50, 100 and 150 μM) Osthole for 48 h. Then the cells were harvested and were stained with Annexin V/PI and flow cytometric analysis was performed to analyze apoptosis rates. (B) Summaries of the apoptosis rates in histograms. *p < 0.05, **p < 0.01, ***p < 0.001 versus control group. (C) Cell apoptosis observed by Hoechst 33342 staining. A549 cells treated with (0, 50, 100 and 150 μM) Osthole for 48 h. Apoptotic cells exhibited chromatin condensations, nuclear fragmentations, and apoptotic bodies.

