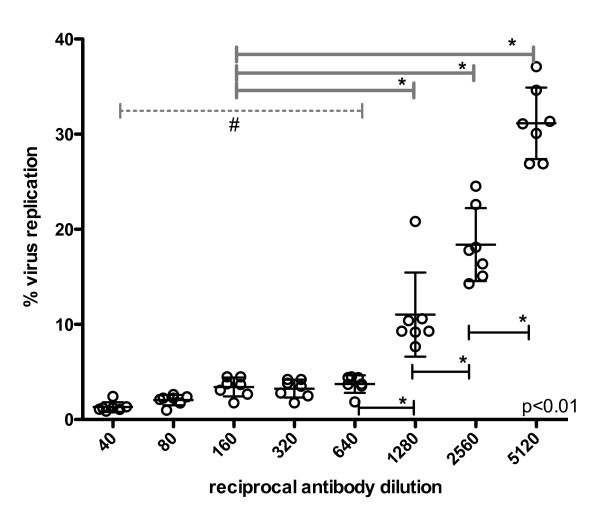
Figure 2.
Determination of neutralizing antibody titer as established using the NT-PCR. Percent virus replication is plotted against antibody dilution and the neutralizing titer is defined by the last antibody dilution step before virus replication is significantly increasing (≥1:640). Data is shown for seven individual runs using mean values from two, three and four single wells. Bars indicate means and SD, as a normal distribution of the repeated measures was assumed. The p-value indicates significant differences across all compared dilution groups (significance indicated by *): # the grey dotted line indicates the range of dilutions from 1:40 to 1:640 where no significant differences between the individual dilution steps are observed, however all individual columns are significantly different to dilutions ≥ 1:640 (1:1280 or higher).

