Figure 1.
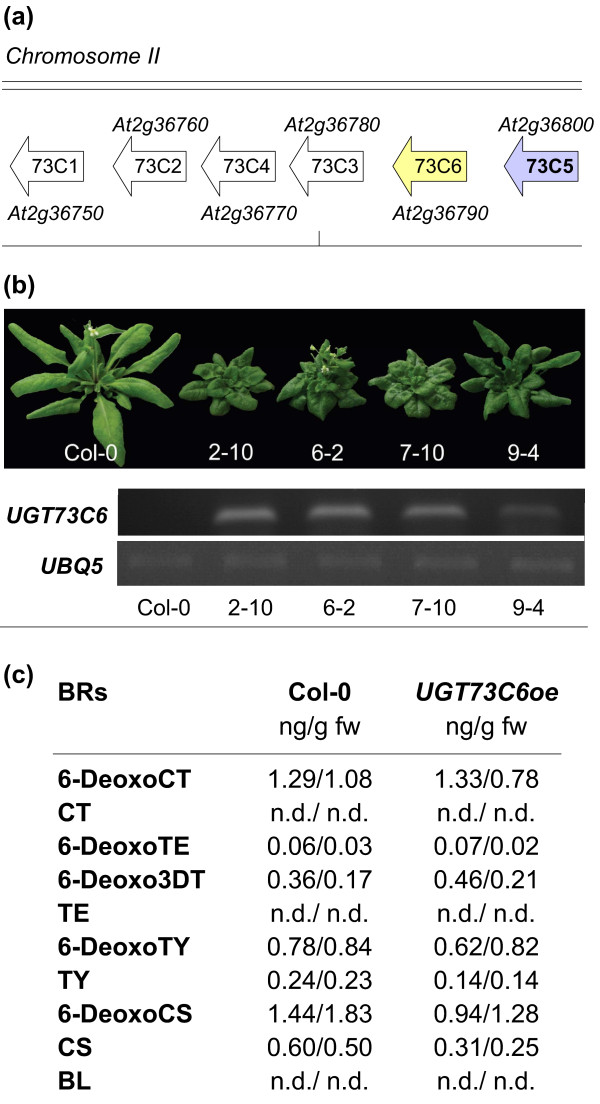
Characterization of UGT73C6 over-expressing lines. (a) Illustration of the UGT73C gene cluster. (b) Adult phenotypes of independent transgenic lines expressing a 35Spro:UGT73C6 construct as compared to wild type Col-0, grown for 4 weeks in long-day conditions (16 hrs 80-100 μmol·m-2·s-1 white light/8 hrs dark) at 21 ± 2°C. Semi-quantitative RT PCR analysis of UGT73C6 transcript levels in the lines whose phenotype is shown. UBQ5 served as an internal control. (c) BR contents in UGT73C6oe plants as compared to wild type. BR contents were quantified by GC-MS in two independent experiments in which aerial tissues of A. thaliana plants, grown in the same conditions as in (a) for 24 d, were compared. BR levels in ng/g fw are shown. nd, not detected (below the limit of detection).

