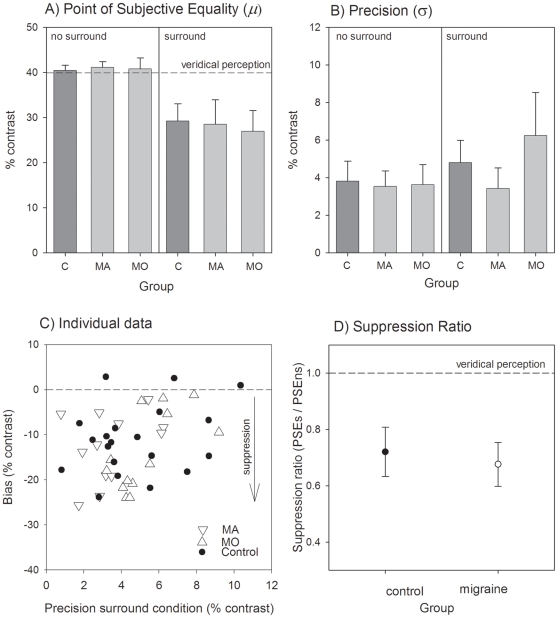
Figure 3. Centre-surround suppression for parallel static gratings.
Panel A shows the PSE for the isolated centre patch (right hand side of panel: LHS) and when presented within the surround (left hand side of panel: RHS). Group means (±95% confidence intervals of the mean) are shown for control participants (C), migraine with aura (MA) and migraine without aura (MO) groups. Panel B shows the precision (spread of psychometric functions for the same groups, also for the no surround (LHS) and surround (RHS) conditions. Individual performance for each participant is shown in Panel C which plots the bias (shift in PSE) against their precision for the surround condition. Panel D shows the group mean (±95% confidence intervals of the mean) suppression ratio for the controls and all pooled migraine participants. The suppression ratio was determined as the PSE for the surround condition divided by that for the no surround condition. A ratio of 1 indicates that the surround has no effect. A reduction in the apparent contrast of the central patch due to the surround results in a suppression index less than 1.

