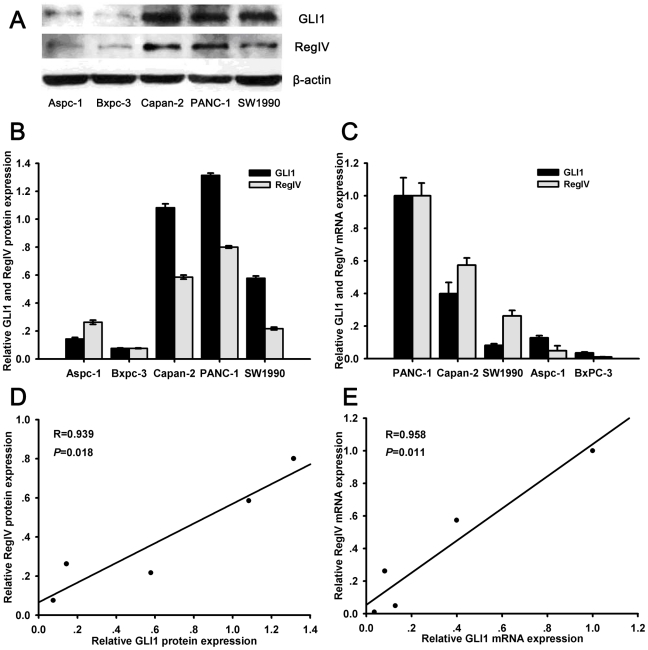
Figure 4. The expression of GLI1 and RegIV in 5 PC cell lines.
Expression of GLI1 and RegIV proteins in 5 pancreatic cancer cell lines as detected by Western blot analysis on cell extracts, using anti-GLI1 and anti-RegIV antibodies (A). β-actin was used as the loading control in all experiments. The results were quantified by determining the intensities of the bands compared with that of β-actin (B). Statistical correlation between expression of GLI1 and RegIV protein in 5 PC cell lines was analyzed by Pearson's test (C). Relative GLI1 and RegIV mRNA expression were examined by qRT-PCR (D). The expression of GLI1 and RegIV mRNA was normalized to β-actin mRNA expression. Statistical correlation between the expression of GLI1 and RegIV mRNA in 5 PC cell lines was analyzed by Pearson's test (E). All data are presented as the mean ± SD of three independent experiments.

