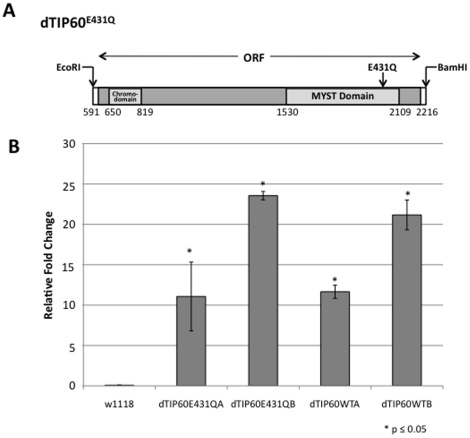
Figure 1. Generation and characterization of transgenic dTip60E431Q and dTip60WT flies.
(A) Schematic of the dTIP60 open reading frame. Shown is the location of the conserved regions encoding for the N-terminal chromo domain and the C-terminal MYST functional domain. An arrow denotes the position site of amino acid substitution E431Q. (B) Exogenous expression levels of dTip60E431Q and dTip60WT in independent fly lines. Shown is a histogram depicting qPCR analysis of exogenous levels of dTip60 in staged three day old second instar larvae progeny resulting from a cross between ubiquitous GAL4 drive 337 and either dTip60E431Q (lines A and B), dTip60WT (lines A and B) or control w1118 flies. To quantify the amount of exogenous expressed dTip60E431Q or dTip60WT, primers were designed to amplify a 97bp non-conserved region of dTip60 (present in both endogenous and exogenous dTip60) and a 105bp non-conserved region within the 5′UTR of dTip60, (present only in endogenous dTip60). For each transgenic line, RNA was extracted and qPCR performed using Power Sybr Green. The cycle threshold (CT) was determined for each primer pair and normalized to the CT value of RP49 (ribosomal protein internal loading control) to account for differences between samples. The relative fold change in mRNA expression levels between exogenous and endogenous dTip60 was measured using the comparative Ct method with Rp49 as the internal control, and these results are summarized in the histogram. Asterisks (*) indicate significant fold change between the respective genotype and control flies with values of p≤0.05; n = 3. Error bars represent standard error of the mean.

