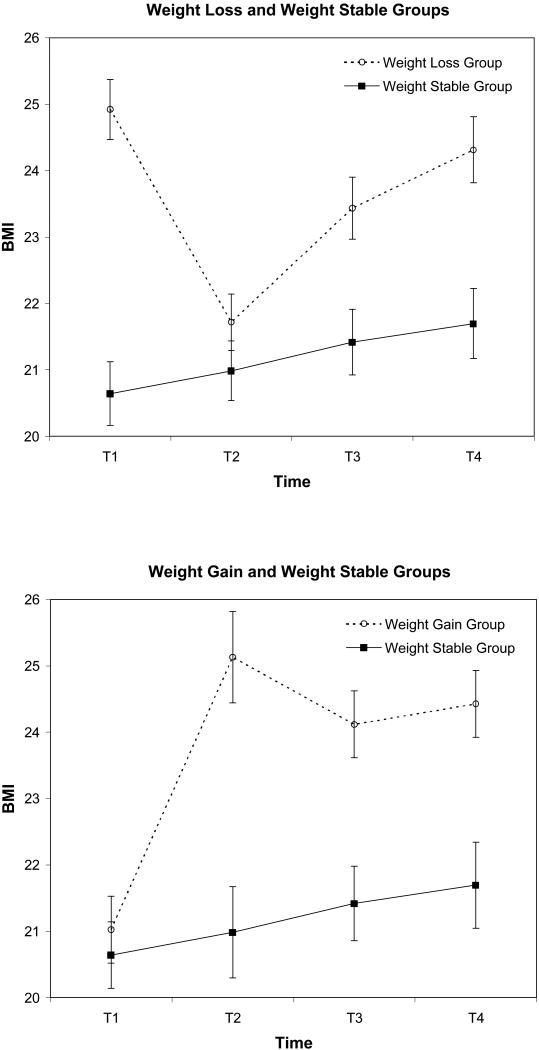
Figure 1.
BMI trajectory of the weight loss group (participants with a 10% age-adjusted BMI decrease) and the weight gain group (participants with a 10% age-adjusted BMI increase) compared to the weight stable group (no year-to-year weight change greater than 5% across the 8 year study). Participants in the two weight change groups were pooled by fixing the year of weight change at T1 to T2. Points represent mean BMI; vertical lines depict standard errors of the means.

