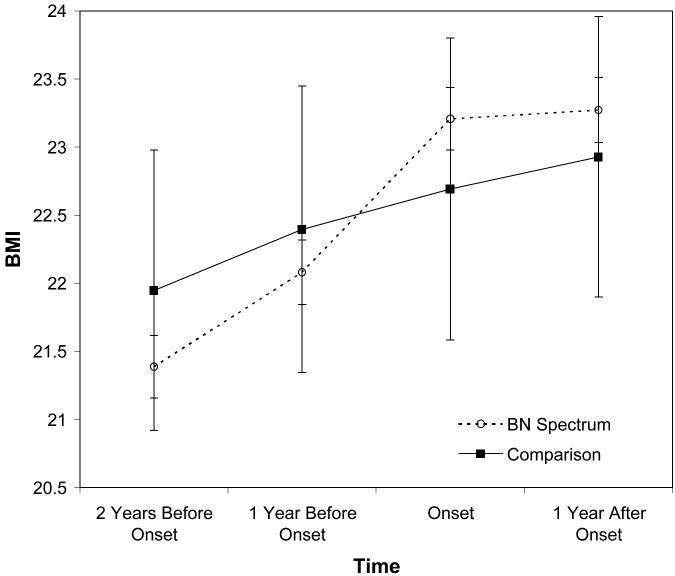
Figure 2.
BMI trajectory of the BN spectrum group (participants who met criteria for clinical or subclinical Bulimia Nervosa) relative to year of first diagnosis, compared to the comparison group (all other participants not meeting a diagnosis of a BN spectrum disorder during the study). Points represent mean BMI; vertical lines depict standard errors of the means.

