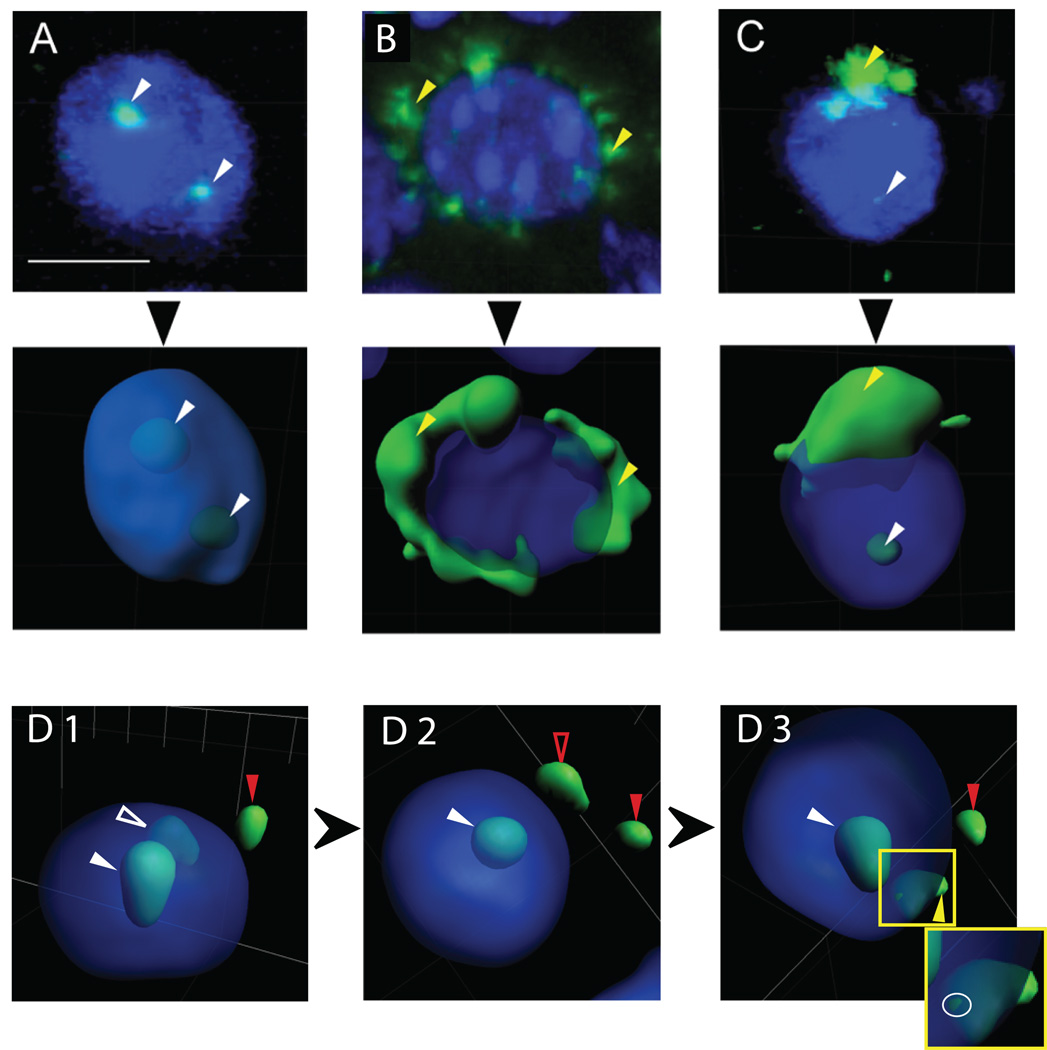
Figure 5.
Classification of Arc mRNA expression. Examples of Arc mRNA expressed in (A) intranuclear foci only, (B) perinuclear cytoplasm only, or (C) both intranuclear foci and perinuclear cytoplasm. Top panels are each confocal z-stacks (projection onto 2D) from a tissue section subjected to FISH. Middle panels represent their respective 3D surface reconstructions. These high-magnification views (63X) illustrate individual nuclear foci (white arrowheads) and diffuse perinuclear cytoplasmic signals (yellow arrowheads). Blue represents DAPI staining of nuclei. Note the detection of two Arc mRNA foci within the nucleus in (A), suggesting active transcription at each allele. (D1–3) The classification advantage of 3D reconstruction is evident from successively rotated views of the same nucleus. The solid red arrowhead in each panel points to a fluorescence signal labeled as background and left unclassified, since it cannot be associated with a specific cell. The solid white arrowhead in each panel indicates a fluorescence signal classified as a focal point of intranuclear Arc expression, since it remains wholly within the nucleus in all views. The open white arrowhead in D1 indicates a potential site of intranuclear expression based on the transparent view, but upon rotation (D2), this fluorescence appears to fall outside the nucleus, potentially representing background expression (open red arrowhead). Further rotation (D3) reveals that the fluorescence surface intersects the DAPI stained nuclear surface (highlighted by white ring around intersection in the Inset, which expands the image within the yellow box in D3), resulting in its classification as a point of perinuclear cytoplasmic expression (yellow arrowhead). This cell is therefore classified as having “both” intranuclear and cytoplasmic expression. Common scale bar shown in (A) is 10 µm.

