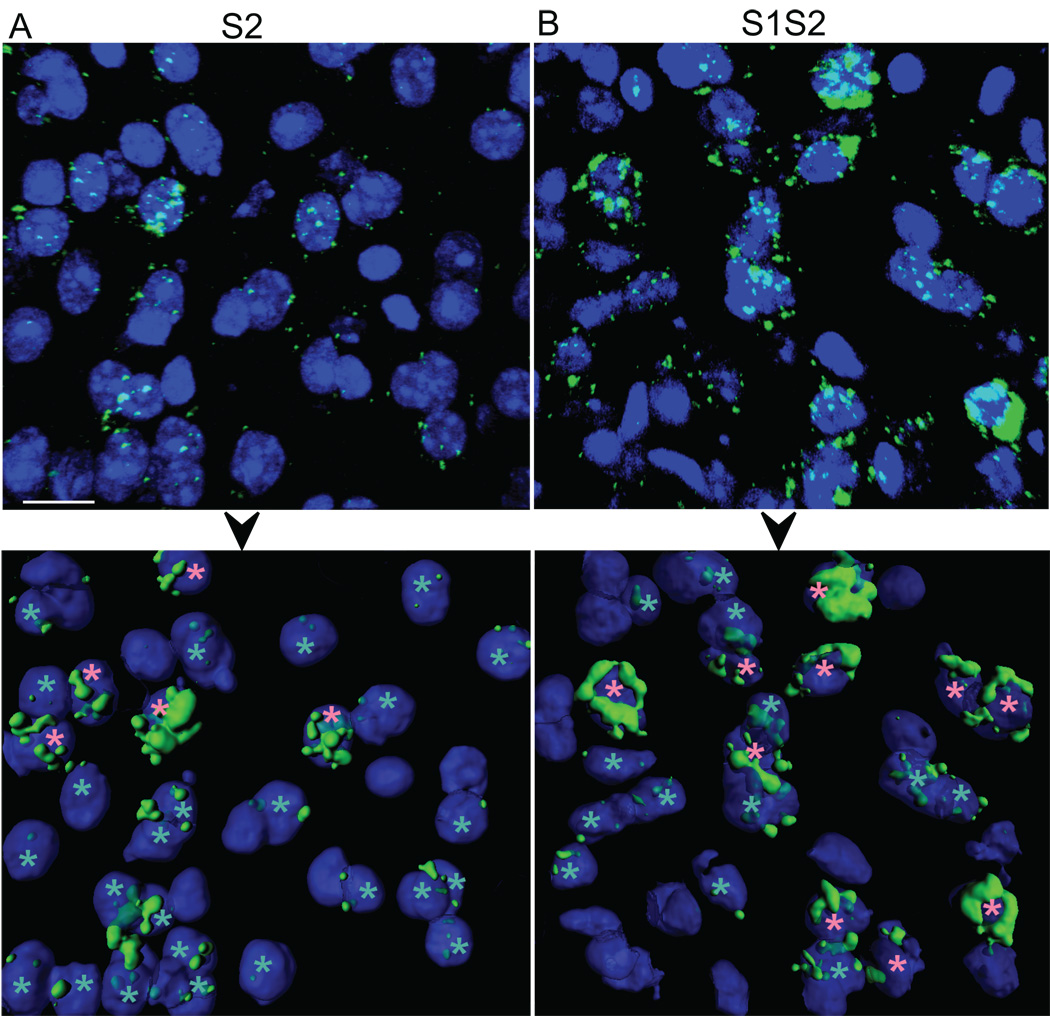
Figure 7.
Examples of sub-cellular compartmental Arc mRNA expression in layers 5–6 for sound-stimulated groups (A) S2 and (B) S1S2. Top panels show raw confocal z-stacks (63X) from tissue sections subjected to FISH. Bottom panels represent the respective 3D surface reconstruction, retaining only probably neuronal (and not glial) cell bodies that are predominantly within the edges of the image. Pink asterisks mark cells with Arc mRNA expression in the perinuclear “cytoplasm only”; cyan asterisks mark those with nuclear-positive Arc mRNA expression (either “intranuclear foci only,” or “both”). Blue represents DAPI staining of nuclei. Scale bar is 15 µm.

