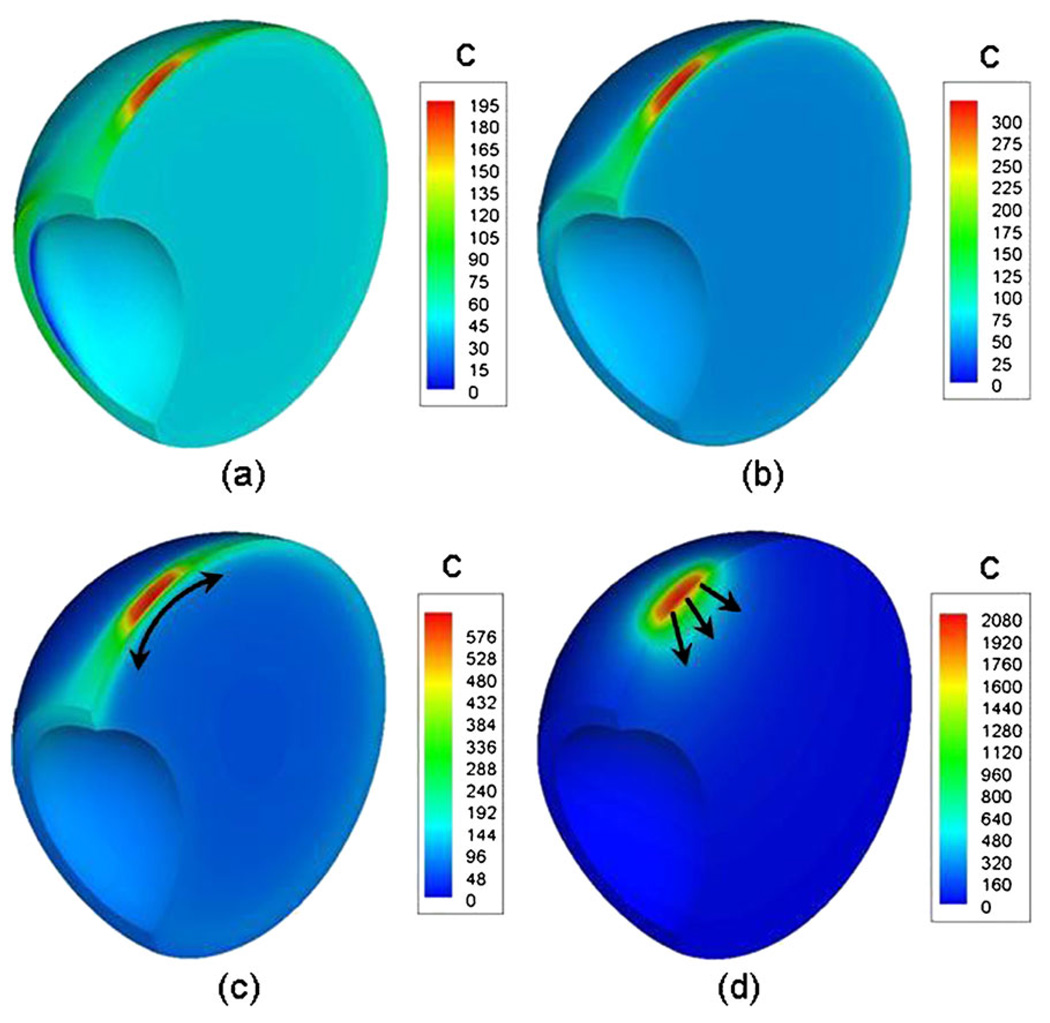
Fig. 7.
Concentration contour plots for the sloshing cases and the static case 48 h after transscleral drug administration. (a), (b), (c) correspond to the sloshing cases with viscosities μ = 0.01, 0.1, and 1.0, respectively. (d) corresponds to the static vitreous. Source concentration for the simulation was 1 × 10⁴.

