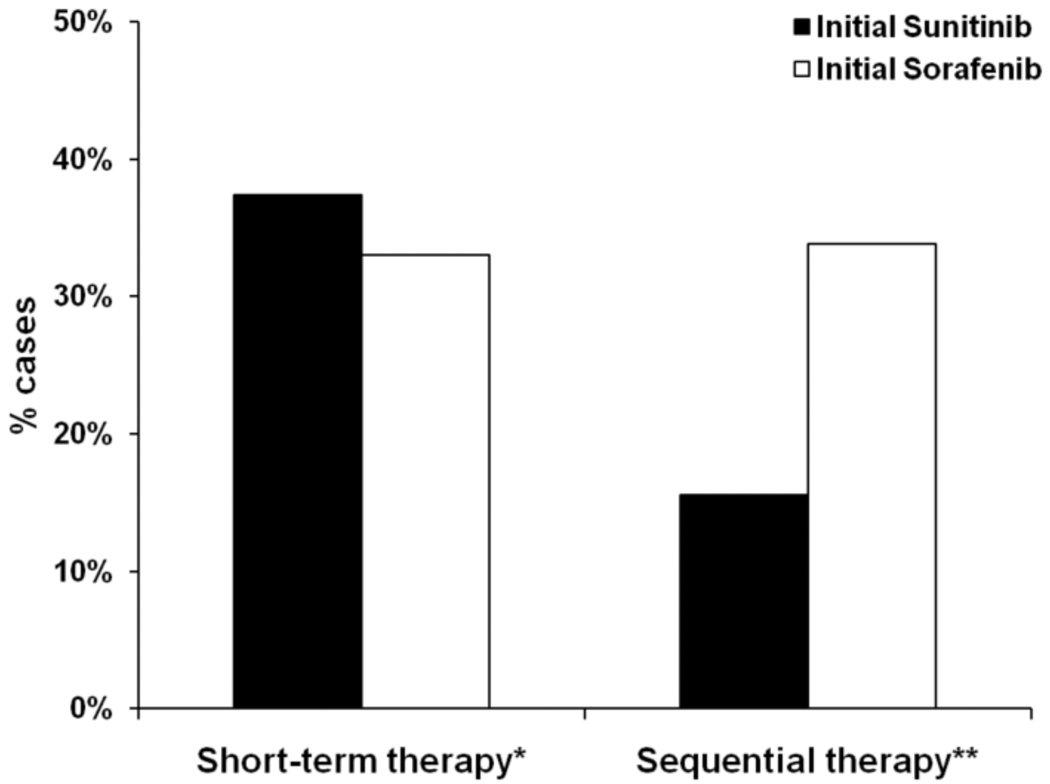
Figure 1.
Initial patterns of use of oral TKIs among RCC patients.
*p=0.177 for comparison between patients receiving initial sunitinib versus initial sorafenib.
**p<0.001 for comparison between patients receiving initial sunitinib versus initial sorafenib
This figure demonstrates the proportion of patients who received the treatment courses of interest (i.e., short-term or sequential therapy). The x-axis corresponds to groups of patients in our analytic cohort who received either short-term therapy (i.e., < 60 days) or sequential therapy (i.e., both sunitinib and sorafenib). The y-axis corresponds to the proportion of cases that received the treatment courses of interest. The black bars represent the proportion of cases who were treated with sunitinib first, and the white bars correspond to those in the analytic cohort who received sorafenib first.

