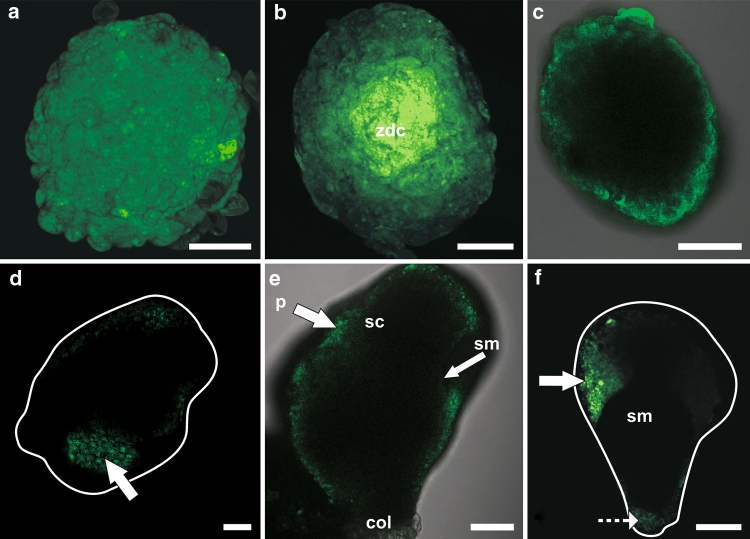
Fig. 4.
Pattern of HPTS distribution in barley androgenic embryos at different stages of development. a In an embryo at the early globular stage, the fluorochrome was present in all embryonic cells. b A similar situation was observed for the globular stage, but the intensity of fluorescence was stronger in the centre of the embryo (zdc). c At the late globular stage, the fluorochrome was present only in the protodermis. d–f This pattern of HPTS distribution was maintained at later stages of embryo development: transitional (d), coleoptilar (e), and mature (f). The white lines indicate the shape of the embryos obtained from bright field micrographs. col coleorhiza, p protodermis, sc scutellum, sm shoot meristem, zdc zone of dividing cells. Arrows point to protodermis. Dashed arrow points to a coleorhiza. Figure 4c and e show overlays of the images from fluorescence and bright field. The images were collected by confocal laser scanning microscopy. Bars = 50 µm (a, b, d), 100 µm (c, e), 200 µm (f)

