
Figure 4.
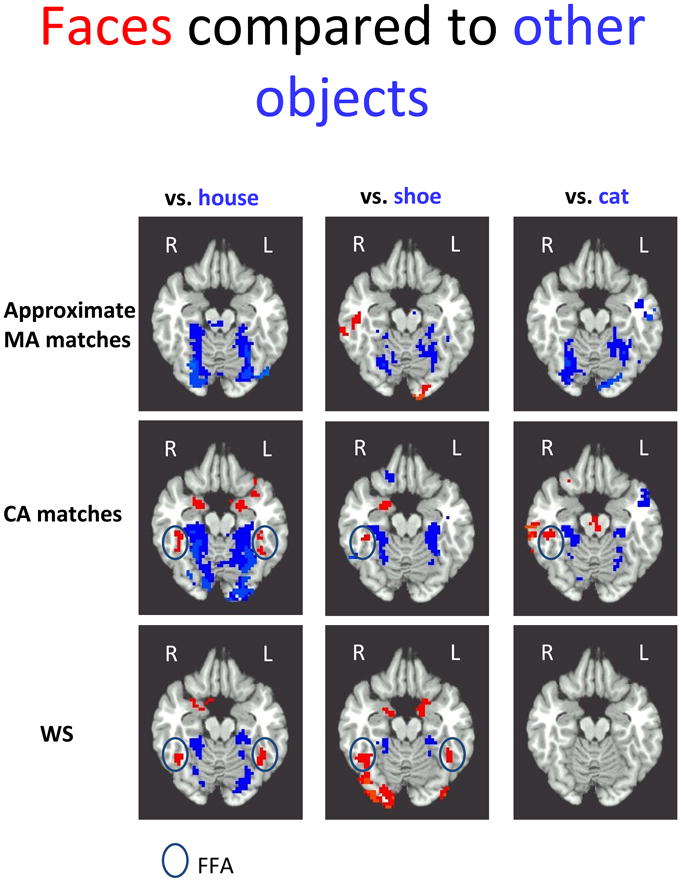
The contrast maps between human faces in red and 3 classes of objects in blue– houses, shoes, and cat faces – is shown for each group at z = −16, with approximate MA matches in row 1, CA matches in row 2, and the WS group in row 3 (See also Table 2). Consistent with previous developmental reports, developmental change in FFA activation is evident in the face vs. house contrast (reported in Table 3), as well as developmental differences in R FFA when faces are compared to shoes and cat faces. The WS group showed bilateral activation to human faces compared to houses and shoes, but less activation to houses, shoes or cat faces than either control group. As expected, there was very little FFA activation when human faces were compared to cat faces. When evident, approximate FFA region is enclosed in a black oval.