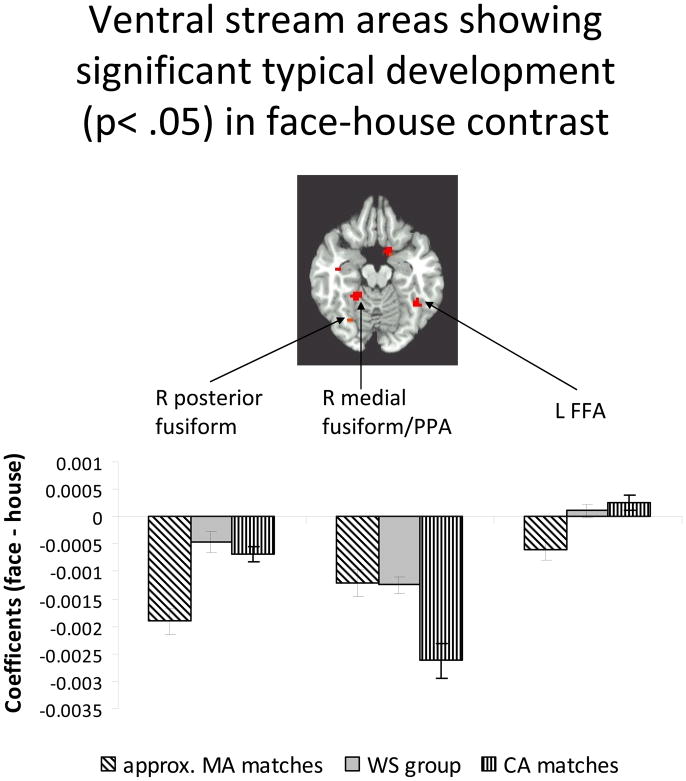
Figure 5.
Regions of significant typical developmental change in the face vs. house contrast were identified. A 6 mm sphere was formed around the peak of the interaction between group (MA, CA matches) and condition (face, house). The mean coefficient of the voxels above threshold in this sphere was graphed. Three regions are shown (illustrated at z = −16), two right fusiform regions more active for houses than faces, and one left fusiform region (FFA) that was more active for faces than houses in the CA matches. In both regions on the right, all groups showed greater activity for houses than faces. In the posterior region, MA matches displayed more activity than CA matches, while the opposite was true of the more anterior medial region. In both cases, the WS group had a level of activation on par with whichever group displayed less activity (CA matches in posterior region, approximate MA matches in anterior region). In L FFA regions, approximate MA matches continued to show slightly more activity for houses but both CA matches and the WS group exhibited more activity for faces in this region. It is not surprising that the WS group showed slightly less activity than the CA matches, since these regions were chosen on the basis of the differences between MA and CA matches, and thus probably utilized regions particularly active for faces in CA matches (which may differ slightly in location from those most active for faces in the WS group).

