Figure 1.
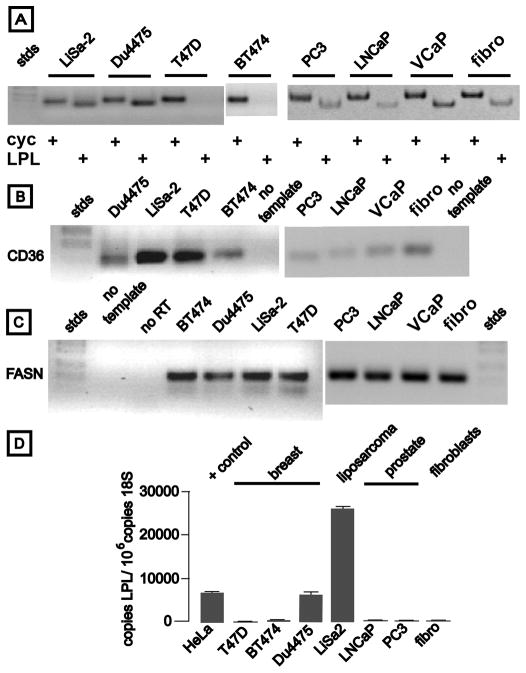
LPL, CD36, and FASN gene expression in cancer cells. Ethidium-stained gel electrophoresis of RT-PCR products is shown in Panels A–C. Cell lines analyzed are listed above each lane. Stds indicates electrophoretic size standards; LiSa-2 is a liposarcoma line; Du4475 are breast cancer cells lacking receptors for sex steroids and trastuzumab; T47D are breast cancer cells with receptors for estrogen and progesterone, but not trastuzumab; BT474 are breast cancer cells with receptors for sex steroids and trastuzumab. PC3, LNCaP, and VCaP are prostate cancer lines; Fibro denotes human fibroblasts. Panel A: Primers corresponded to cyclophilin (cyclo) or LPL mRNAs. Panel B: Primers corresponded to the fatty acid translocase CD36. Panel C: Primers detected FASN mRNA. Panel D depicts real time RT-PCR quantitation of LPL mRNA (normalized to 18S rRNA, mean ± SEM, n = 3 wells/cell line). HeLa adenocarcinoma cells are included as a positive control, as we previously reported expression of LPL mRNA by this cell line (25).

