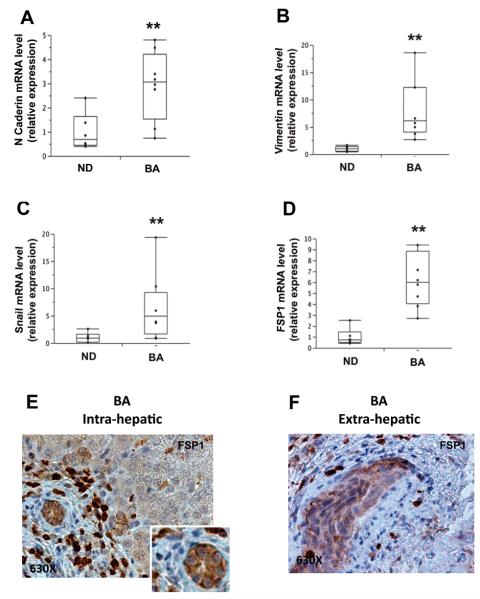
Figure 5. Hedgehog activation in biliary atresia was accompanied by EMT in ductular cells.
(A-D) QRT-PCR analysis of EMT markers (i.e. N-Cadherin, Vimentin,, Snail, FSP1) in livers from pediatric patients with BA (N=9) and age-matched controls (CTL) (N=6). Gene expression data in disease livers are expressed relative to levels in control subjects and presented as box-and-whisker plots. Significance was evaluated by Wilcoxon rank-sum test. ** Significant Wilcoxon rank-sum test vs NL control. (E-F) Immunohistochemical analysis for FSP1 was performed in both livers (E) and extrahepatic biliary remnants (F) from BA patients. Final magnifications 630X (E-F).

