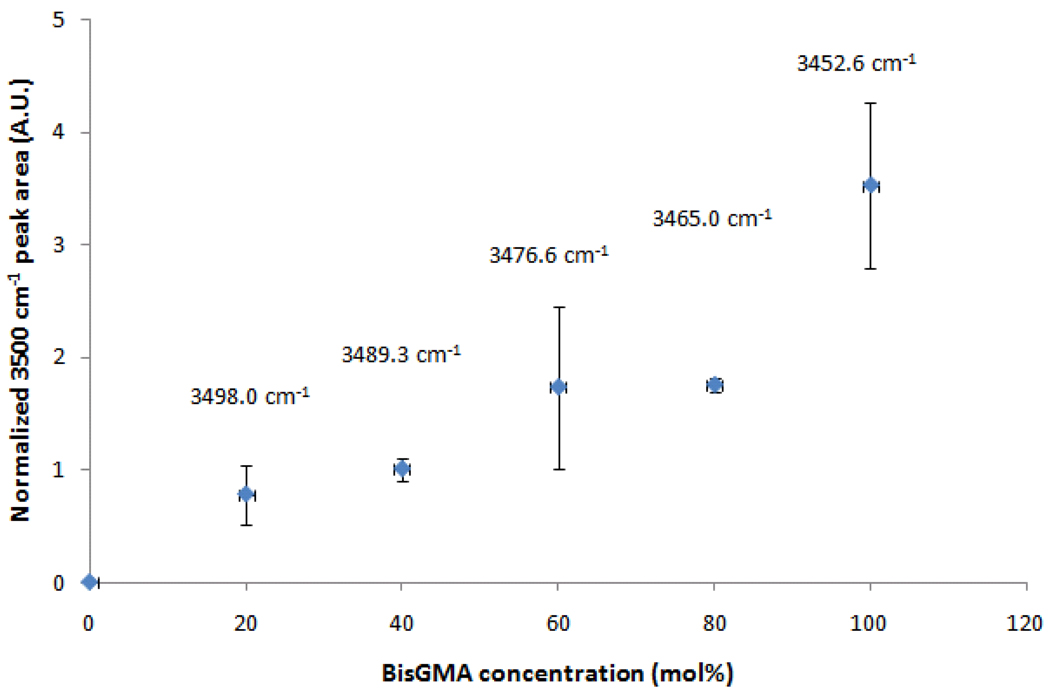
Figure 1.
Hydrogen bonding interactions of BisGMA/TEGDMA comonomer mixtures. The area under the peak at 3500 cm−1 was normalized for the methacrylate concentration in the mixture (by being divided by the aromatic peak area) and is shown in arbitrary units. Each data point is accompanied by the 3500 cm−1 peak position in wavenumbers.

