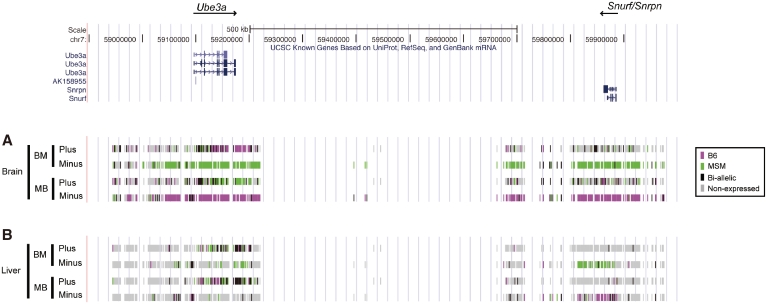
Figure 2.
Transcriptional landscape of the Ube3a–Snurf/Snrpn region. Status of strand- and allele-specific expression at Ube3a–Snurf locus in brain (A), and in liver (B). Each color indicates the expression status for every SNP site: B6 allele (magenta), MSM allele (green), both alleles (black) and non-expressed (light gray). Intensity value thresholds were set by the discriminant analysis method (25) to distinguish between expressed and non-expressed SNP sites and to distinguish between the three types of expressed allele. Assays were performed for both of the reciprocal hybrids, BM (B6xMSM) and MB (MSMxB6). The former indicates maternally contributed strain. Expression strands are distinguished by plus and minus. ‘Plus’ denotes those that detect the expression from plus-strand of the UCSC mouse genome assembly, whereas ‘Minus’ indicates the expression from minus-strand. Gene location is denoted in the upper panel: thick and narrow bars colored navy indicate exonic and intronic regions, respectively.

